

Question: #1 Required: Complete the financial statement analysis (below) for XYZ Inc. Common-size (vertical) analysis: Condensed Income Statement 2018 2017 Common Size Common Size Sales revenue
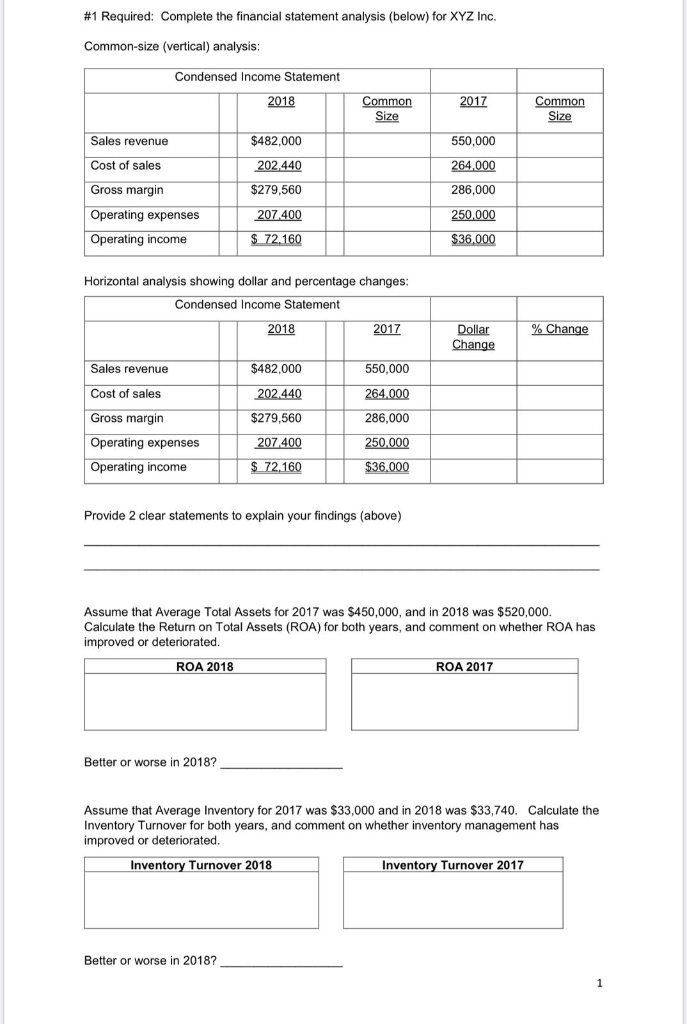
#1 Required: Complete the financial statement analysis (below) for XYZ Inc. Common-size (vertical) analysis: Condensed Income Statement 2018 2017 Common Size Common Size Sales revenue $482,000 202.440 $279,560 550,000 264,000 286,000 Cost of sales Gross margin Operating expenses Operating income 207,400 $ 72,160 250,000 $36.000 Horizontal analysis showing dollar and percentage changes: Condensed Income Statement 2018 2017 % Change Dollar Change Sales revenue $482,000 550,000 202.440 $279,560 Cost of sales Gross margin Operating expenses Operating income 264.000 286,000 250,000 207,400 $ 72,160 $36.000 Provide 2 clear statements to explain your findings (above) Assume that Average Total Assets for 2017 was $450,000, and in 2018 was $520,000. Calculate the Return on Total Assets (ROA) for both years, and comment on whether ROA has improved or deteriorated. ROA 2018 ROA 2017 Better or worse in 2018? Assume that Average Inventory for 2017 was $33,000 and in 2018 was $33,740. Calculate the Inventory Turnover for both years, and comment on whether inventory management has improved or deteriorated. Inventory Turnover 2018 Inventory Turnover 2017 Better or worse in 2018
Step by Step Solution
There are 3 Steps involved in it

Get step-by-step solutions from verified subject matter experts