

Question: 1-) Review the data display for graph 1 and identify what type of graph it is and describe what the data show. 2-) Review the
1-) Review the data display for graph 1 and identify what type of graph it is and describe what the data show.
2-) Review the data display for graph 2 and identify what type of graph it is and describe what the data show.
So it could be reversal (AB / ABAB / ABCD), multiple baseline changing criterion, alternating treatment, or multi element graph. Explain why?
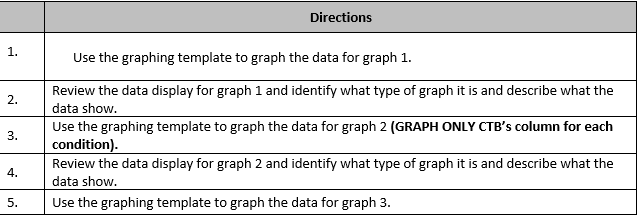
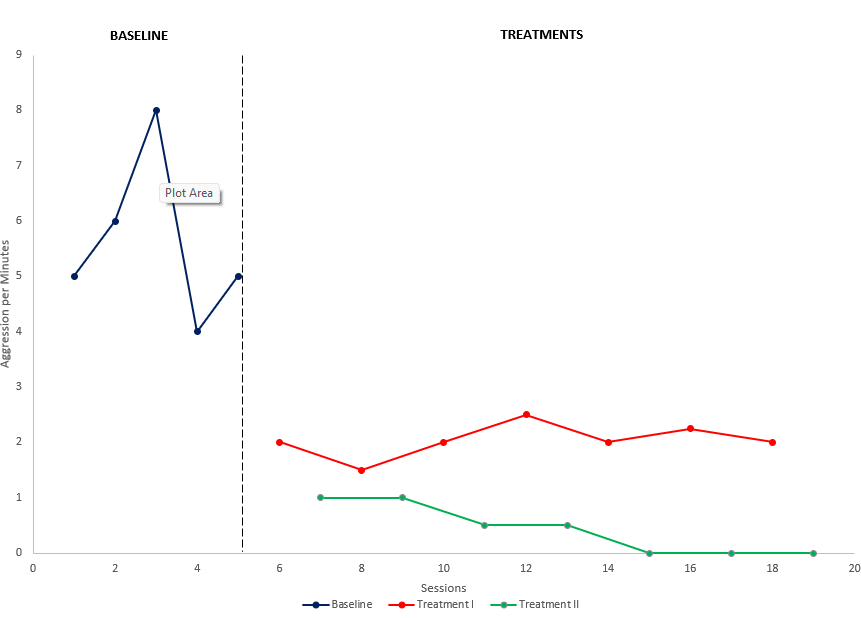
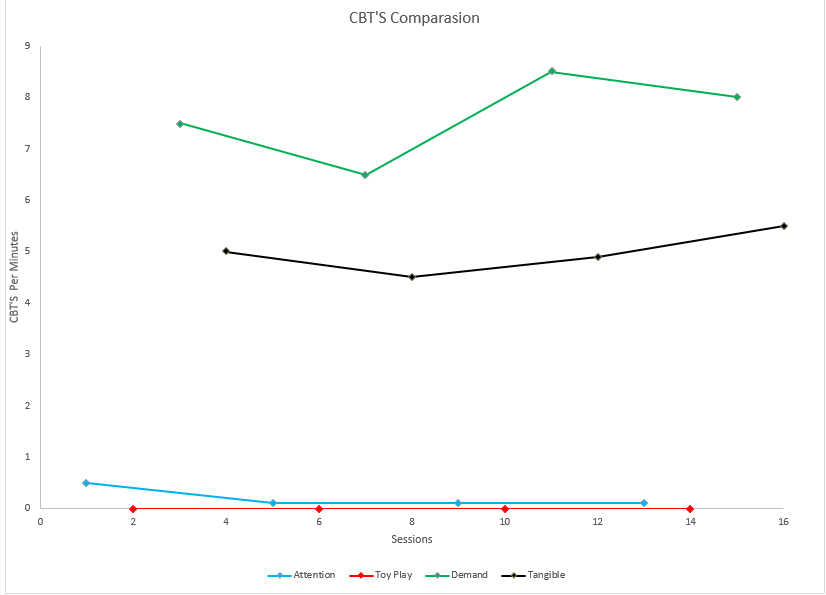
Use the graphing template to graph the data for graph 1. Review the data display for graph 1 and identify what type of graph it is and describe what the data show. Use the graphing template to graph the data for graph 2 (GRAPH ONLY CTB's column for each condition). Review the data display for graph 2 and identify what type of graph it is and describe what the data show. Use the graphing template to graph the data for graph 3. BASELINE TREATMENTS 9 Plot Area 5 Aggression per Minutes 2 2 4 6 8 10 12 14 16 18 20 Sessions Baseline Treatment | --Treatment IICBT'S Comparasion 9 8 7 6 CBT'S Per Minutes 4 2 1 A 10 12 14 16 Sessions Attention +Toy Play *Demand Tangible
Step by Step Solution
There are 3 Steps involved in it

Get step-by-step solutions from verified subject matter experts