

Question: Run an empirical CAPM regression to estimate beta for each company and report your estimates Run a market model regression to estimate beta for each
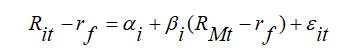
Run an “empirical” CAPM regression to estimate beta for each company and report your estimates
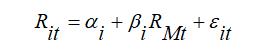
- Run a market model regression to estimate beta for each company and report your estimates
- Compare the two estimates for each company and explain why they differ or not
- Which company has a higher beta? Why do you think this is the case? Briefly explain.
- Interpret the intercept parameter for each firm.
- Interpret the R2 from the CAPM regression for both firms
Note: You can find the The Beta estimation excel table below contains the following info:
Market risk premium and risk-free rate Monthly returns for two firms, Company X and Company Y. Monthly returns are
computed from monthly adjusted prices.
| Market and risk-free (FF site) | Company X | Company Y | ||||||
| Date | Mkt-RF | RF | Date | Adj Close | Return | Date | Adj Close | Return |
| 201605 | 5/1/2016 | 39,622,597 | 5/1/2016 | 722,789,978 | ||||
| 201606 | -0.05 | 0.02 | 6/1/2016 | 33,320,332 | -15.9057343 | 6/1/2016 | 715,619,995 | -0.9919871 |
| 201607 | 3.95 | 0.02 | 7/1/2016 | 35,442,291 | 6.368360915 | 7/1/2016 | 758,809,998 | 6.03532647 |
| 201608 | 0.5 | 0.02 | 8/1/2016 | 33,613,014 | -5.161283169 | 8/1/2016 | 769,159,973 | 1.36397452 |
| 201609 | 0.25 | 0.02 | 9/1/2016 | 36,198,021 | 7.690494521 | 9/1/2016 | 837,309,998 | 8.86031871 |
| 201610 | -2.02 | 0.02 | 10/1/2016 | 38,414,421 | 6.122986668 | 10/1/2016 | 789,820,007 | -5.6717334 |
| 201611 | 4.86 | 0.01 | 11/1/2016 | 44,309,471 | 15.34592959 | 11/1/2016 | 750,570,007 | -4.9694867 |
| 201612 | 1.82 | 0.03 | 12/1/2016 | 45,447,014 | 2.567268293 | 12/1/2016 | 749,869,995 | -0.0932641 |
| 201701 | 1.94 | 0.04 | 1/1/2017 | 43,645,393 | -3.96422304 | 1/1/2017 | 823,479,980 | 9.81636624 |
R.. it =a;+P;(R,
Step by Step Solution
3.49 Rating (152 Votes )
There are 3 Steps involved in it
Answer While the CAPM offers simple and intuitive explanation for the relationship between return and risk the empirical record of the prediction made ... View full answer

Get step-by-step solutions from verified subject matter experts