

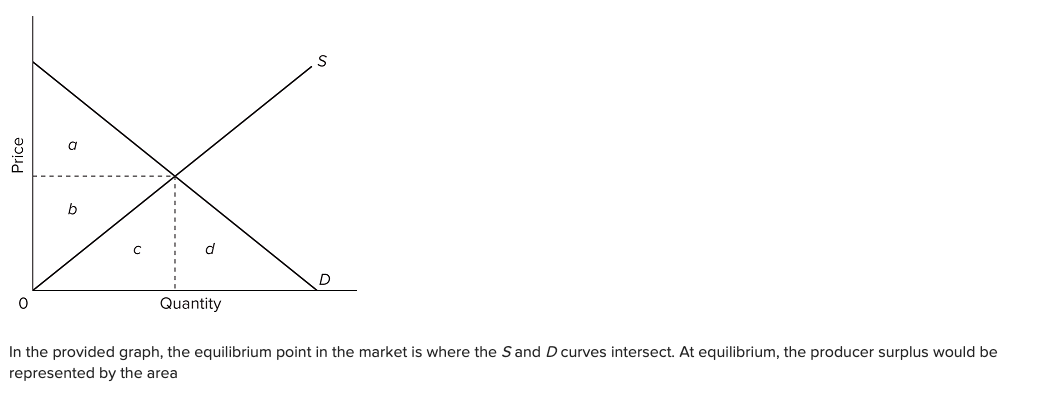
Question: 1 S Price b C d D 0 Quantity represented by the area In the provided graph, the equilibrium point in the market is where


1


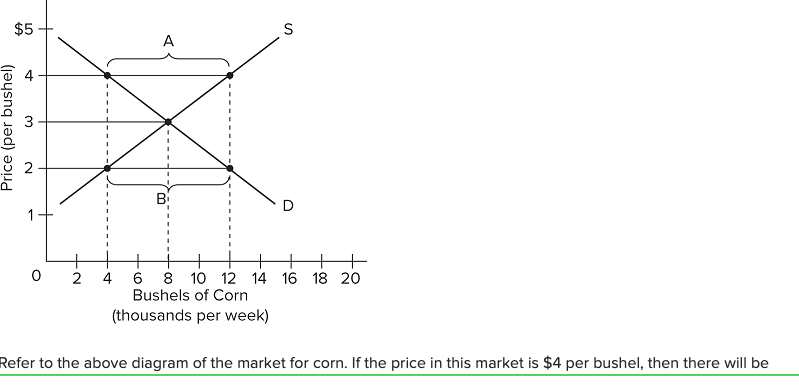

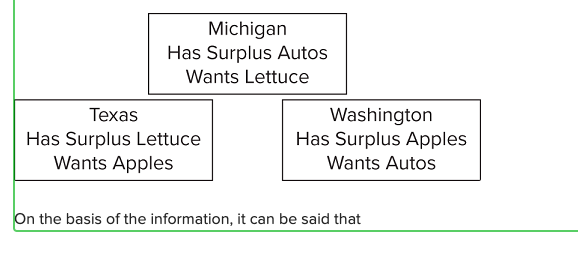

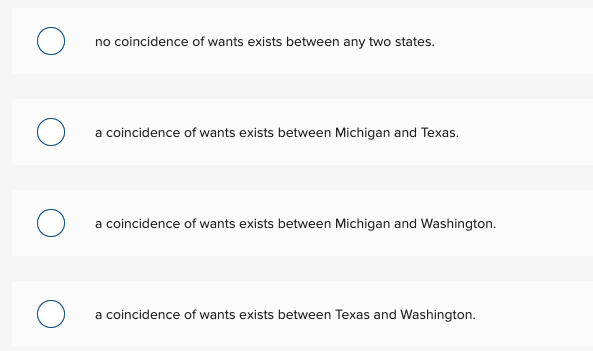
S Price b C d D 0 Quantity represented by the area In the provided graph, the equilibrium point in the market is where the Sand D curves intersect. At equilibrium, the producer surplus would be\f$5 S A 4 3 Price (per bushel) 2 D 1 0 2 4 6 8 10 12 14 16 18 20 Bushels of Corn (thousands per week) Refer to the above diagram of the market for corn. If the price in this market is $4 per bushel, then there will beMultiple Choice O a surplus of 8 thousand bushels. O a surplus of 12 thousand bushels. O a shortage of 8 thousand bushels. O a shortage of 4 thousand bushels.Michigan Has Surplus Autos Wants Lettuce Texas Washington Has Surplus Lettuce Has Surplus Apples Wants Apples Wants Autos On the basis of the information, it can be said thatO no coincidence of wants exists between any two states. O a coincidence of wants exists between Michigan and Texas. O a coincidence of wants exists between Michigan and Washington. O a coincidence of wants exists between Texas and Washington
Step by Step Solution
There are 3 Steps involved in it

Get step-by-step solutions from verified subject matter experts