

Question: 1 Sample no 1 2 3 4 5 45 49 45 48 46 52 48 53 49 55 47 3 49 41 45 60 4
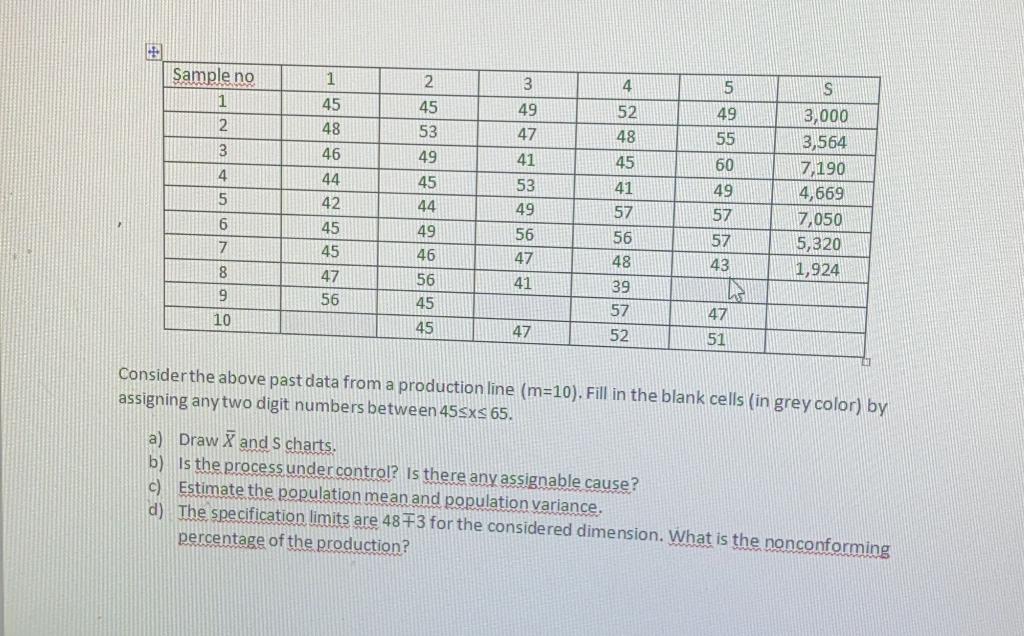
1 Sample no 1 2 3 4 5 45 49 45 48 46 52 48 53 49 55 47 3 49 41 45 60 4 44 HNMUNO 45 49 S 3,000 3,564 7,190 4,669 7,050 5,320 1,924 42 44 57 45 6 7 53 49 56 47 41 45 41 57 56 48 39 57 52 57 43 49 46 56 45 45 8 9 10 47 56 47 47 51 Consider the above past data from a production line (m=10). Fill in the blank cells (in grey color) by assigning any two digit numbers between 45sxs 65. a) Draw X and S charts, b) is the process under control? Is there any assignable cause? c) Estimate the population mean and population variance. d) The specification limits are 4873 for the considered dimension. What is the nonconforming percentage of the production? 1 Sample no 1 2 3 4 5 45 49 45 48 46 52 48 53 49 55 47 3 49 41 45 60 4 44 HNMUNO 45 49 S 3,000 3,564 7,190 4,669 7,050 5,320 1,924 42 44 57 45 6 7 53 49 56 47 41 45 41 57 56 48 39 57 52 57 43 49 46 56 45 45 8 9 10 47 56 47 47 51 Consider the above past data from a production line (m=10). Fill in the blank cells (in grey color) by assigning any two digit numbers between 45sxs 65. a) Draw X and S charts, b) is the process under control? Is there any assignable cause? c) Estimate the population mean and population variance. d) The specification limits are 4873 for the considered dimension. What is the nonconforming percentage of the production
Step by Step Solution
There are 3 Steps involved in it

Get step-by-step solutions from verified subject matter experts