

Question: 1. Section #1 Attempted: 0/25 Question 2 Q Revisit Later Choose the best option & Clea Let's get back to question 1, suppose we estimated
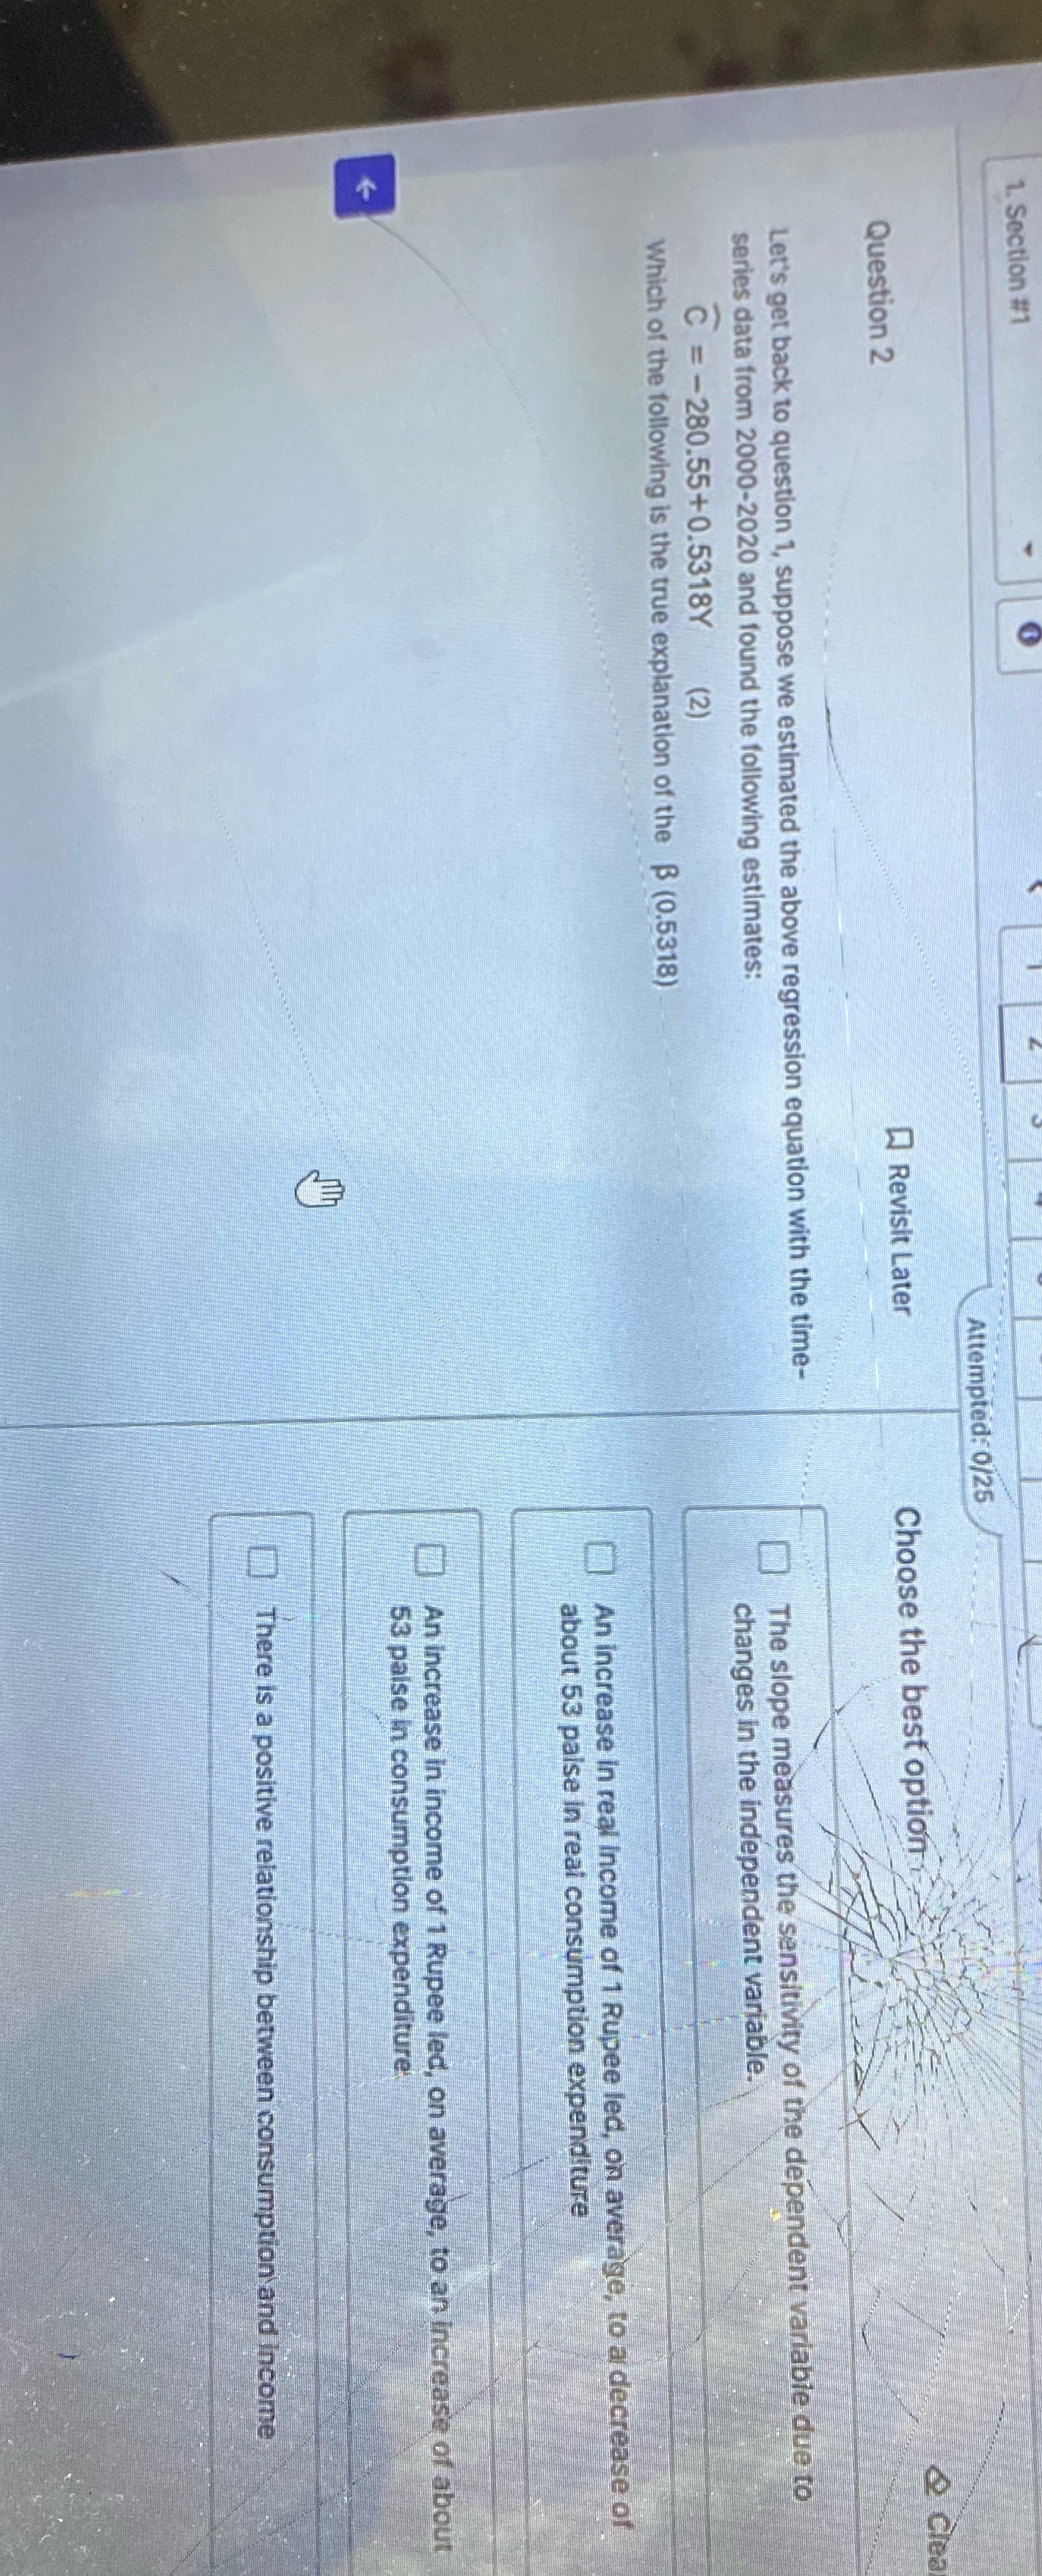
1. Section #1 Attempted: 0/25 Question 2 Q Revisit Later Choose the best option & Clea Let's get back to question 1, suppose we estimated the above regression equation with the time- series data from 2000-2020 and found the following estimates: The slope measures the sensitivity of the dependent variable due to changes in the independent variable. C = -280.55+0.5318Y Which of the following is the true explanation of the B (0.5318) An increase in real Income of 1 Rupee led, on average, to a decrease of about 53 palse in real consumption expenditure An increase in income of 1 Rupee led, on average, to an increase of about 53 palse in consumption expenditure There is a positive relationship between consumption and income
Step by Step Solution
There are 3 Steps involved in it

Get step-by-step solutions from verified subject matter experts