

Question: 1 Select one answer. 10 points Final and course grade: We recorded the final exam (in percent) and course grade (in percent) for 75 statistics
1
Select one answer.
10 points
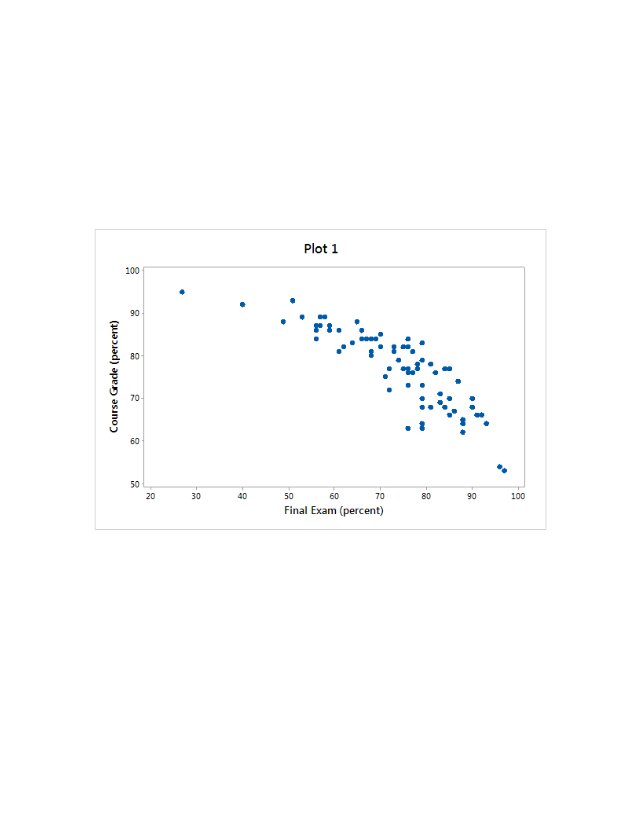
Final and course grade:We recorded the final exam (in percent) and course grade (in percent) for 75 statistics students. Which of the following scatterplots shows that students with higher final exam scores tend to have higher course grades?
- Plot 1
- Plot 2
- Plot 3
Question 2
Select one answer.
10 points
Which of the plots has negative linear association?
- Plot 1
- Plot 2
- Plot 3
- Plot 4
Question 3
Select one answer.
10 points
Which of the plots has the strongest linear association?
- Plot 1
- Plot 2
- Plot 3
- Plot 4
Question 1 Select one answer. 10 points Final and course grade: We recorded the final exam (in percent) and course grade (in percent) for 75 statistics students. Which of the following scatterplots shows that students with higher final exam scores tend to have higher course grades? Plot 1 Plot 2 Plot 3 Question 2 Select one answer. 10 points Which of the plots has negative linear association? Plot 1 Plot 2 Plot 3 Plot 4 Question 3 Select one answer. 10 points Which of the plots has the strongest linear association? Plot 1 Plot 2 Plot 3 Plot 4
Step by Step Solution
There are 3 Steps involved in it

Get step-by-step solutions from verified subject matter experts