

Question: 1. Select two news headlines, one from each column. You will create one graph to show a change in demand and one graph to
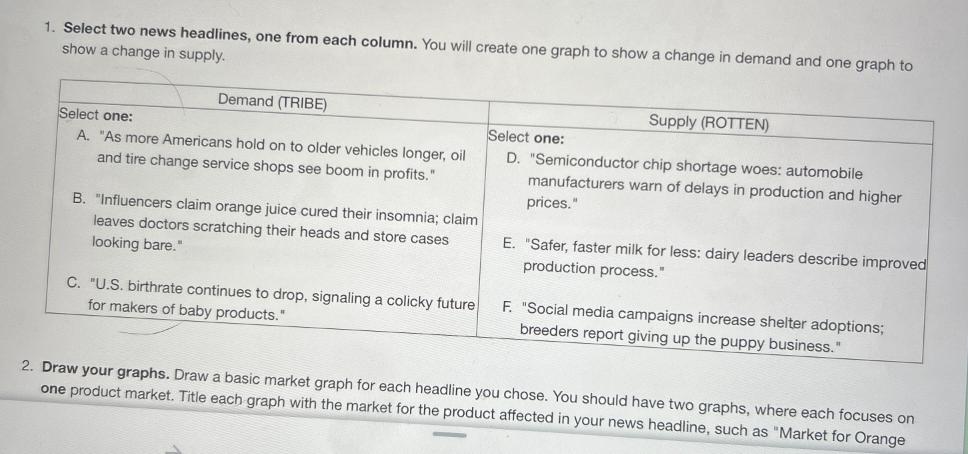
1. Select two news headlines, one from each column. You will create one graph to show a change in demand and one graph to show a change in supply. Select one: Demand (TRIBE) A. "As more Americans hold on to older vehicles longer, oil and tire change service shops see boom in profits." B. "Influencers claim orange juice cured their insomnia; claim leaves doctors scratching their heads and store cases looking bare." C. "U.S. birthrate continues to drop, signaling a colicky future for makers of baby products." Select one: Supply (ROTTEN) D. "Semiconductor chip shortage woes: automobile manufacturers warn of delays in production and higher prices." E. "Safer, faster milk for less: dairy leaders describe improved production process." F. "Social media campaigns increase shelter adoptions; breeders report giving up the puppy business." 2. Draw your graphs. Draw a basic market graph for each headline you chose. You should have two graphs, where each focuses on one product market. Title each graph with the market for the product affected in your news headline, such as "Market for Orange
Step by Step Solution
3.51 Rating (158 Votes )
There are 3 Steps involved in it
Here are two news headlines one from each column Headline 1 Column 1 Orange Production Hits Record L... View full answer

Get step-by-step solutions from verified subject matter experts