

Question: 1. Set forth and compare the business cases for each of the two projections under consideration by Emily Harris. Which do you regard as more
1. Set forth and compare the business cases for each of the two projections under consideration by
Emily Harris. Which do you regard as more compelling?
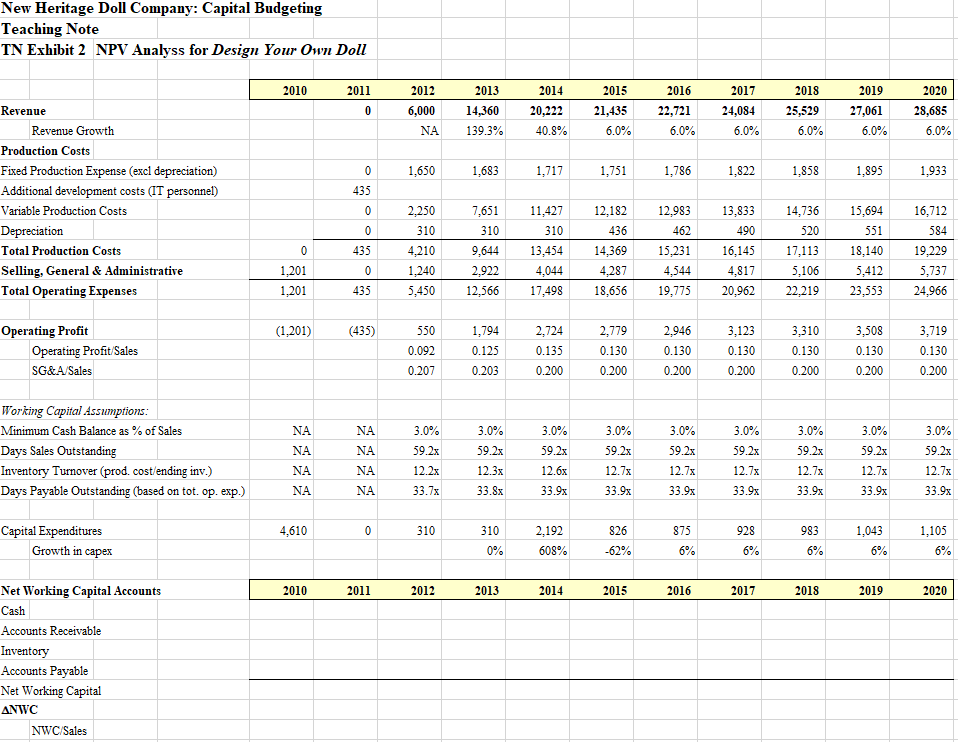
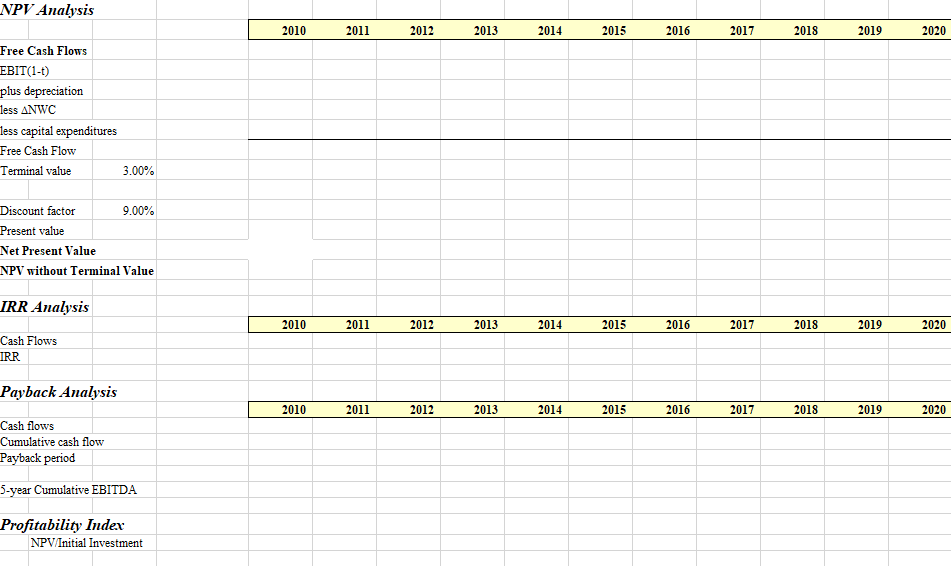
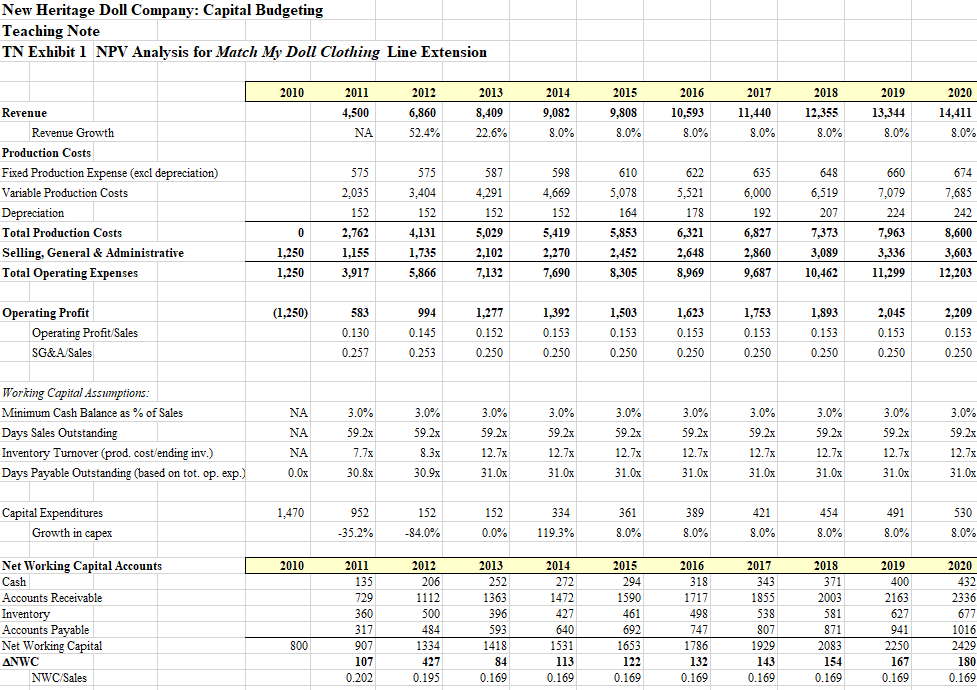
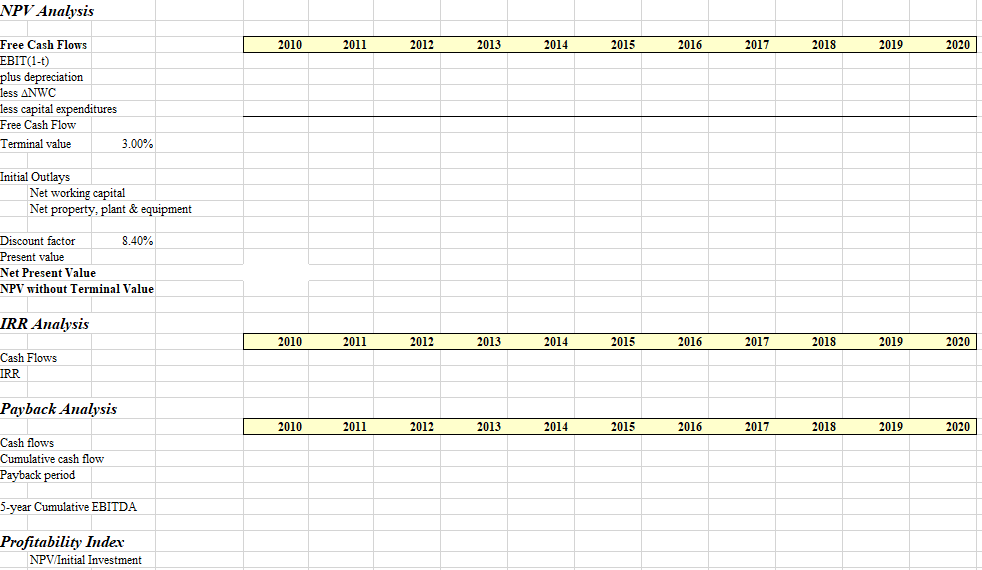
2. Use the operating projections for each project to compute net present value (NPV) for each. Which
project creates more value? (Ensure you attach a spreadsheet of calculations)
3. Compute the internal rate of return (IRR) and payback period for each project. How should these
metrics affect Harriss deliberations? How do they compare to NPV as tools for evaluating projects?
When and how would you use each? (Ensure you attach a spreadsheet of calculations)
4. What additional information does Harris need to complete her analyses and compare the two
projects? What specific questions should she ask each of the project sponsors?
5. If Harris is forced to recommend one project over the other, which should she recommend? Why?
New Heritage Doll Company: Capital Budgeting Teaching Note TN Exhibit 2 NPV Analyss for Design Your Own Doll 2010 2011 2020 0 2012 6,000 NA 2013 14,360 139.3% 2014 20,222 40.8% 2015 21,435 6.0% 2016 22,721 6.0% 2017 24,084 6.0% 2018 25,529 6.0% 2019 27,061 6.0% 28,685 6.0% 0 1,650 1,683 1,717 1,751 1,786 1,822 1,858 1,895 1,933 435 Revenue Revenue Growth Production Costs Fixed Production Expense (excl depreciation) Additional development costs (IT personnel) Variable Production Costs Depreciation Total Production Costs Selling, General & Administrative Total Operating Expenses 0 16,712 584 0 0 1,201 435 0 435 2.250 310 4,210 1,240 5,450 7,651 310 9,644 2,922 12,566 11,427 310 13,454 4,044 17,498 12,182 436 14,369 4,287 18,656 12,983 462 15,231 4,544 19,775 13,833 490 16,145 4,817 20,962 14,736 520 17,113 5,106 22.219 15,694 551 18,140 5,412 23,553 19,229 5,737 24,966 1,201 (1,201) (435) Operating Profit Operating Profit/Sales SG&A/Sales 550 0.092 0.207 1,794 0.125 0.203 2,724 0.135 0.200 2,779 0.130 0.200 2,946 0.130 0.200 3,123 0.130 0.200 3,310 0.130 0.200 3,508 0.130 0.200 3,719 0.130 0.200 NA 3.0% 3.0% 3.0% 3.0% 3.0% 3.0% Working Capital Assumptions: Minimum Cash Balance as % of Sales Days Sales Outstanding Inventory Turnover (prod. cost/ending inv.) Days Payable Outstanding (based on tot. op. exp.) NA NA 3.0% 59.2x 3.0% 59.2x 3.0% 59.2x NA 59.2x 59.2x 59.2x 59.2x 59.2x 59.2x NA 12.6x 12.7x 12.7x NA NA 12.2x 33.7x 12.3x 33.8x 12.7x 33.9x 12.7x 33.9x 12.7x 33.9x 12.7x 33.9x NA 33.9x 33.9x 33.9x 4,610 0 310 310 826 875 983 Capital Expenditures Growth in capex 2,192 608% 928 6% 1,043 6% 1,105 6% 0% -62% 6% 6% 2010 2011 2012 2013 2014 2015 2016 2017 2018 2019 2020 Net Working Capital Accounts Cash Accounts Receivable Inventory Accounts Payable Net Working Capital ANWC NWC/Sales NPV Analysis 2010 2011 2012 2013 2014 2015 2016 2017 2018 2019 2020 Free Cash Flows EBIT(1-1) plus depreciation Hess ANWC less capital expenditures Free Cash Flow Terminal value 3.00% Discount factor 9.00% Present value Net Present Value NPV without Terminal Value IRR Analysis 2010 2011 2012 2013 2014 2015 2016 2017 2018 2019 2020 Cash Flows IRR Payback Analysis 2010 2011 2012 2013 2014 2015 2016 2017 2018 2019 2020 Cash flows Cumulative cash flow Payback period 5-year Cumulative EBITDA Profitability Index NPV/Initial Investment New Heritage Doll Company: Capital Budgeting Teaching Note TN Exhibit 1 NPV Analysis for Match My Doll Clothing Line Extension 2010 2013 2011 4,500 NA 2012 6,860 52.4% 8,409 2014 9,082 8.0% 2015 9,808 8.0% 2016 10,593 8.0% 2017 11,440 8.0% 2018 12,355 8.0% 2019 13,344 8.0% 2020 14,411 8.0% 22.6% 575 610 Revenue Revenue Growth Production Costs Fixed Production Expense (excl depreciation) Variable Production Costs Depreciation Total Production Costs Selling, General & Administrative Total Operating Expenses 635 6,000 2,035 5,078 192 575 3,404 152 4,131 1,735 5,866 587 4,291 152 5,029 2.102 152 2.762 1,155 3,917 598 4,669 152 5,419 2,270 7,690 622 5,521 178 6,321 2,648 8,969 164 5,853 2,452 648 6,519 207 7.373 3,089 10,462 660 7,079 224 7,963 3,336 11,299 0 674 7,685 242 8,600 3,603 12,203 1,250 1,250 6,827 2,860 9,687 7.132 8,305 (1,250) 1,277 Operating Profit Operating Profit/Sales SG&A/Sales 583 0.130 0.257 994 0.145 1,392 0.153 0.250 1,503 0.153 0.152 0.250 1.623 0.153 0.250 1,753 0.153 0.250 1,893 0.153 0.250 2,045 0.153 0.250 2,209 0.153 0.250 0.253 0.250 Working Capital Assumptions: Minimum Cash Balance as % of Sales Days Sales Outstanding Inventory Turnover (prod. cost/ending inv.) Days Payable Outstanding (based on tot. op. exp.) NA NA NA 0.0x 3.0% 59.2x 7.7x 30.8x 3.0% 59.2x 8.3x 30.9x 3.0% 59.2x 12.7x 31.0x 3.0% 59.2x 12.7x 31.0x 3.0% 59.2x 12.7x 31.0x 3.0% 59.2x 12.7x 31.0x 3.0% 59.2x 12.7x 31.0x 3.0% 59.2x 12.7x 31.0x 3.0% 59.2x 12.7x 31.0x 3.0% 59.2x 12.7x 31.0x 1,470 952 152 334 389 454 530 Capital Expenditures Growth in capex 152 0.0% 361 8.0% 421 8.0% 491 8.0% -35.2% -84.0% 119.3% 8.0% 8.0% 8.0% Net Working Capital Accounts 2010 Cash Accounts Receivable Inventory Accounts Payable Net Working Capital ANWC NWC/Sales 2011 135 729 360 317 907 107 0.202 2012 206 1112 500 404 484 1334 427 2013 252 1363 396 593 1418 84 0.169 2014 272 1472 427 640 1531 113 2015 294 1590 461 692 1653 122 0.169 2016 318 1717 498 747 1786 132 0.169 2017 343 1855 538 807 1929 143 2018 371 2003 581 871 2083 154 0.169 2019 400 2163 627 941 2250 167 0.169 2020 432 2336 677 1016 2429 180 0.169 800 0.195 0.169 0.169 NPV Analysis 2010 2011 2012 2013 2014 2015 2016 2017 2018 2019 2020 Free Cash Flows EBIT(1-1) plus depreciation Hess ANWC less capital expenditures Free Cash Flow Terminal value 3.00% Initial Outlays Net working capital Net property, plant & equipment Discount factor 8.40% Present value Net Present Value NPV without Terminal Value IRR Analysis 2010 2011 2012 2013 2014 2015 2016 2017 2018 2019 2020 Cash Flows IRR Payback Analysis 2010 2011 2012 2013 2014 2015 2016 2017 2018 2019 2020 Cash flows Cumulative cash flow Payback period 5-year Cumulative EBITDA Profitability Index NPV/Initial Investment New Heritage Doll Company: Capital Budgeting Teaching Note TN Exhibit 2 NPV Analyss for Design Your Own Doll 2010 2011 2020 0 2012 6,000 NA 2013 14,360 139.3% 2014 20,222 40.8% 2015 21,435 6.0% 2016 22,721 6.0% 2017 24,084 6.0% 2018 25,529 6.0% 2019 27,061 6.0% 28,685 6.0% 0 1,650 1,683 1,717 1,751 1,786 1,822 1,858 1,895 1,933 435 Revenue Revenue Growth Production Costs Fixed Production Expense (excl depreciation) Additional development costs (IT personnel) Variable Production Costs Depreciation Total Production Costs Selling, General & Administrative Total Operating Expenses 0 16,712 584 0 0 1,201 435 0 435 2.250 310 4,210 1,240 5,450 7,651 310 9,644 2,922 12,566 11,427 310 13,454 4,044 17,498 12,182 436 14,369 4,287 18,656 12,983 462 15,231 4,544 19,775 13,833 490 16,145 4,817 20,962 14,736 520 17,113 5,106 22.219 15,694 551 18,140 5,412 23,553 19,229 5,737 24,966 1,201 (1,201) (435) Operating Profit Operating Profit/Sales SG&A/Sales 550 0.092 0.207 1,794 0.125 0.203 2,724 0.135 0.200 2,779 0.130 0.200 2,946 0.130 0.200 3,123 0.130 0.200 3,310 0.130 0.200 3,508 0.130 0.200 3,719 0.130 0.200 NA 3.0% 3.0% 3.0% 3.0% 3.0% 3.0% Working Capital Assumptions: Minimum Cash Balance as % of Sales Days Sales Outstanding Inventory Turnover (prod. cost/ending inv.) Days Payable Outstanding (based on tot. op. exp.) NA NA 3.0% 59.2x 3.0% 59.2x 3.0% 59.2x NA 59.2x 59.2x 59.2x 59.2x 59.2x 59.2x NA 12.6x 12.7x 12.7x NA NA 12.2x 33.7x 12.3x 33.8x 12.7x 33.9x 12.7x 33.9x 12.7x 33.9x 12.7x 33.9x NA 33.9x 33.9x 33.9x 4,610 0 310 310 826 875 983 Capital Expenditures Growth in capex 2,192 608% 928 6% 1,043 6% 1,105 6% 0% -62% 6% 6% 2010 2011 2012 2013 2014 2015 2016 2017 2018 2019 2020 Net Working Capital Accounts Cash Accounts Receivable Inventory Accounts Payable Net Working Capital ANWC NWC/Sales NPV Analysis 2010 2011 2012 2013 2014 2015 2016 2017 2018 2019 2020 Free Cash Flows EBIT(1-1) plus depreciation Hess ANWC less capital expenditures Free Cash Flow Terminal value 3.00% Discount factor 9.00% Present value Net Present Value NPV without Terminal Value IRR Analysis 2010 2011 2012 2013 2014 2015 2016 2017 2018 2019 2020 Cash Flows IRR Payback Analysis 2010 2011 2012 2013 2014 2015 2016 2017 2018 2019 2020 Cash flows Cumulative cash flow Payback period 5-year Cumulative EBITDA Profitability Index NPV/Initial Investment New Heritage Doll Company: Capital Budgeting Teaching Note TN Exhibit 1 NPV Analysis for Match My Doll Clothing Line Extension 2010 2013 2011 4,500 NA 2012 6,860 52.4% 8,409 2014 9,082 8.0% 2015 9,808 8.0% 2016 10,593 8.0% 2017 11,440 8.0% 2018 12,355 8.0% 2019 13,344 8.0% 2020 14,411 8.0% 22.6% 575 610 Revenue Revenue Growth Production Costs Fixed Production Expense (excl depreciation) Variable Production Costs Depreciation Total Production Costs Selling, General & Administrative Total Operating Expenses 635 6,000 2,035 5,078 192 575 3,404 152 4,131 1,735 5,866 587 4,291 152 5,029 2.102 152 2.762 1,155 3,917 598 4,669 152 5,419 2,270 7,690 622 5,521 178 6,321 2,648 8,969 164 5,853 2,452 648 6,519 207 7.373 3,089 10,462 660 7,079 224 7,963 3,336 11,299 0 674 7,685 242 8,600 3,603 12,203 1,250 1,250 6,827 2,860 9,687 7.132 8,305 (1,250) 1,277 Operating Profit Operating Profit/Sales SG&A/Sales 583 0.130 0.257 994 0.145 1,392 0.153 0.250 1,503 0.153 0.152 0.250 1.623 0.153 0.250 1,753 0.153 0.250 1,893 0.153 0.250 2,045 0.153 0.250 2,209 0.153 0.250 0.253 0.250 Working Capital Assumptions: Minimum Cash Balance as % of Sales Days Sales Outstanding Inventory Turnover (prod. cost/ending inv.) Days Payable Outstanding (based on tot. op. exp.) NA NA NA 0.0x 3.0% 59.2x 7.7x 30.8x 3.0% 59.2x 8.3x 30.9x 3.0% 59.2x 12.7x 31.0x 3.0% 59.2x 12.7x 31.0x 3.0% 59.2x 12.7x 31.0x 3.0% 59.2x 12.7x 31.0x 3.0% 59.2x 12.7x 31.0x 3.0% 59.2x 12.7x 31.0x 3.0% 59.2x 12.7x 31.0x 3.0% 59.2x 12.7x 31.0x 1,470 952 152 334 389 454 530 Capital Expenditures Growth in capex 152 0.0% 361 8.0% 421 8.0% 491 8.0% -35.2% -84.0% 119.3% 8.0% 8.0% 8.0% Net Working Capital Accounts 2010 Cash Accounts Receivable Inventory Accounts Payable Net Working Capital ANWC NWC/Sales 2011 135 729 360 317 907 107 0.202 2012 206 1112 500 404 484 1334 427 2013 252 1363 396 593 1418 84 0.169 2014 272 1472 427 640 1531 113 2015 294 1590 461 692 1653 122 0.169 2016 318 1717 498 747 1786 132 0.169 2017 343 1855 538 807 1929 143 2018 371 2003 581 871 2083 154 0.169 2019 400 2163 627 941 2250 167 0.169 2020 432 2336 677 1016 2429 180 0.169 800 0.195 0.169 0.169 NPV Analysis 2010 2011 2012 2013 2014 2015 2016 2017 2018 2019 2020 Free Cash Flows EBIT(1-1) plus depreciation Hess ANWC less capital expenditures Free Cash Flow Terminal value 3.00% Initial Outlays Net working capital Net property, plant & equipment Discount factor 8.40% Present value Net Present Value NPV without Terminal Value IRR Analysis 2010 2011 2012 2013 2014 2015 2016 2017 2018 2019 2020 Cash Flows IRR Payback Analysis 2010 2011 2012 2013 2014 2015 2016 2017 2018 2019 2020 Cash flows Cumulative cash flow Payback period 5-year Cumulative EBITDA Profitability Index NPV/Initial Investment
Step by Step Solution
There are 3 Steps involved in it

Get step-by-step solutions from verified subject matter experts