

Question: 1. Shown below are the summary statistics for test scores from two different AP Statistics classes --- one taught first period and one taught third
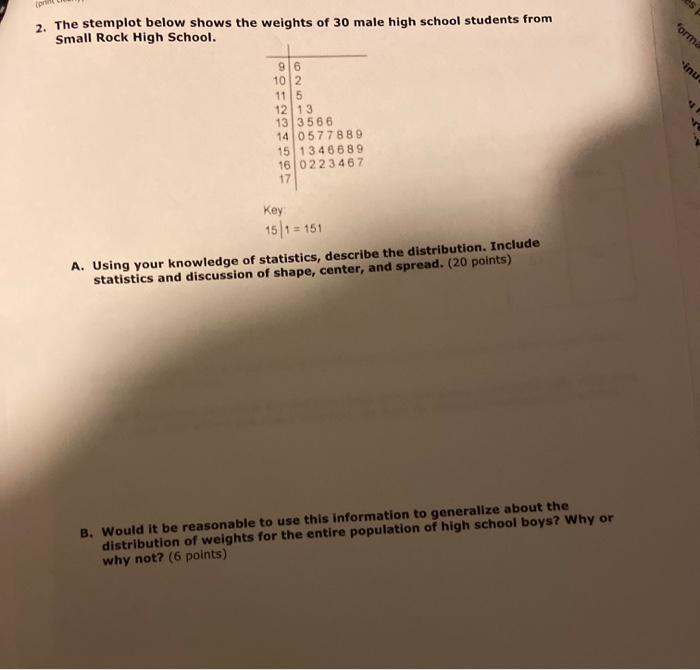
(print 2. The stemplot below shows the weights of 30 male high school students from Small Rock High School. "orma inu 96 10 2 11 5 12 13 13 3566 14 0577889 15 1346689 16 0223467 17 Key: 15 1= 151 A. Using your knowledge of statistics, describe the distribution. Include statistics and discussion of shape, center, and spread. (20 points) B. Would it be reasonable to use this information to generalize about the distribution of weights for the entire population of high school boys? Why or why not? (6 points)
Step by Step Solution
3.47 Rating (157 Votes )
There are 3 Steps involved in it
Required solution 1 Ans a Ans b Based on the abovecreated graph it seems that the secondperiod class ... View full answer

Get step-by-step solutions from verified subject matter experts