

Question: 1. Six new brands (A, B, C, D, E, and F) of fertilizer that a farmer can use to grow crops just came on the
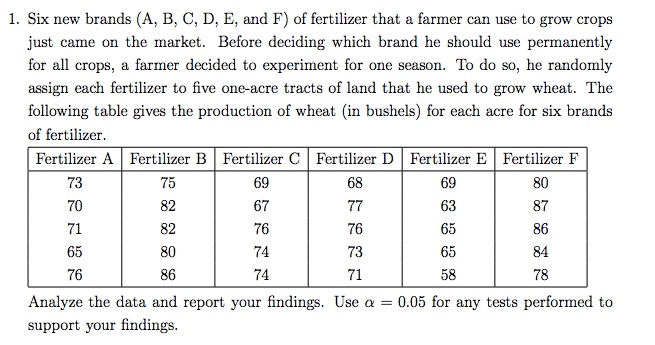
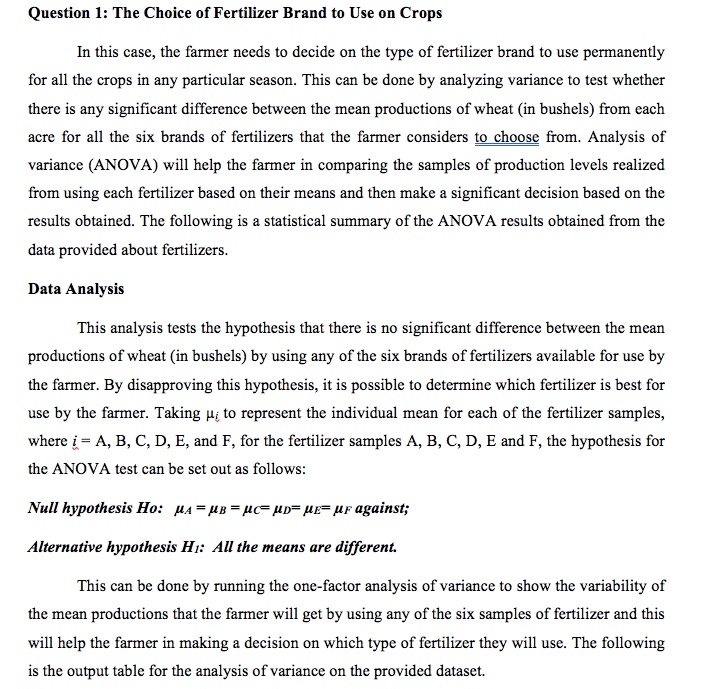
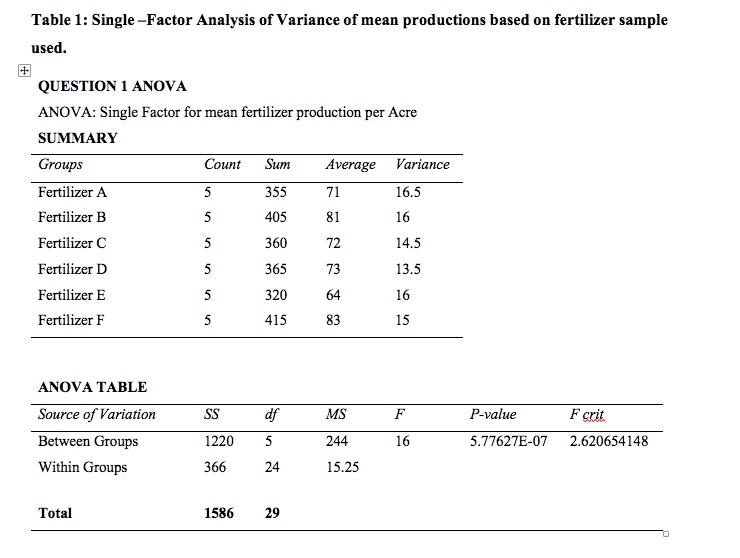
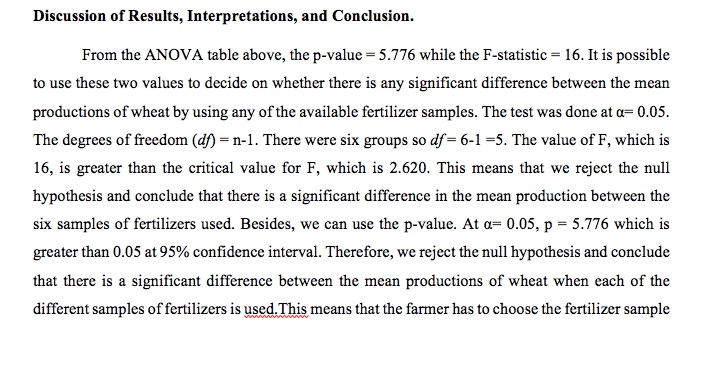
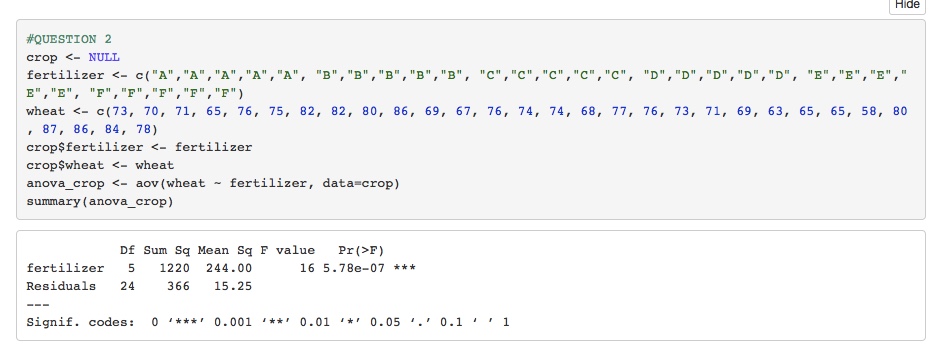
1. Six new brands (A, B, C, D, E, and F) of fertilizer that a farmer can use to grow crops just came on the market. Before deciding which brand he should use permanently for all crops, a farmer decided to experiment for one season. To do so, he randomly assign each fertilizer to five one-acre tracts of land that he used to grow wheat. The following table gives the production of wheat (in bushels) for each acre for six brands of fertilizer. Fertilizer A Fertilizer B Fertilizer C Fertilizer D Fertilizer E Fertilizer F 75 69 68 69 80 82 67 77 63 87 71 82 76 76 65 86 80 74 73 65 84 76 86 74 71 58 78 Analyze the data and report your findings. Use a = 0.05 for any tests performed to support your findings.Question 1: The Choice of Fertilizer Brand to Use on Crops In this case, the farmer needs to decide on the type of fertilizer brand to use permanently for all the crops in any particular season. This can be done by analyzing variance to test whether there is any significant difference between the mean productions of wheat (in bushels) from each acre for all the six brands of fertilizers that the farmer considers to choose from. Analysis of variance (ANOVA) will help the farmer in comparing the samples of production levels realized from using each fertilizer based on their means and then make a significant decision based on the results obtained. The following is a statistical summary of the ANOVA results obtained from the data provided about fertilizers. Data Analysis This analysis tests the hypothesis that there is no significant difference between the mean productions of wheat (in bushels) by using any of the six brands of fertilizers available for use by the farmer. By disapproving this hypothesis, it is possible to determine which fertilizer is best for use by the farmer. Taking ; to represent the individual mean for each of the fertilizer samples, where i = A, B, C, D, E, and F, for the fertilizer samples A, B, C, D, E and F, the hypothesis for the ANOVA test can be set out as follows: Null hypothesis Ho: HA = UB = UC= UD= HE= UF against; Alternative hypothesis HI: All the means are different. This can be done by running the one-factor analysis of variance to show the variability of the mean productions that the farmer will get by using any of the six samples of fertilizer and this will help the farmer in making a decision on which type of fertilizer they will use. The following is the output table for the analysis of variance on the provided dataset.Table 1: Single -Factor Analysis of Variance of mean productions based on fertilizer sample used. QUESTION 1 ANOVA ANOVA: Single Factor for mean fertilizer production per Acre SUMMARY Groups Count Sum Average Variance Fertilizer A 355 71 16.5 Fertilizer B 405 81 16 Fertilizer C 360 72 14.5 Fertilizer D Un 365 73 13.5 Fertilizer E 320 64 16 Fertilizer F 415 83 15 ANOVA TABLE Source of Variation SS MS F P-value F crit Between Groups 1220 244 16 5.77627E-07 2.620654148 Within Groups 366 24 15.25 Total 1586 29Discussion of Results, Interpretations, and Conclusion. From the ANDVA table above, the p-value = 5.7% while the F-statistic = 16. It is possible to use these two values to decide on whether there is any significant difference between the mean productions of wheat by using any of the available fertilizer samples. The test was done at {F 0.05. The degrees of freedom {d = n-l. There were six groups so df= 6-] =5. The value of F, which is 16, is greater than the critical value for F, which is 2.620. This means that we reject the null hypothesis and conclude that there is a significant difference in the mean production between the six samples of fertilizers used. Besides, we can use the p-value. At o= [1.06, p = 5.??6 which is greater than Ill at 95% condence interval. Therefore, we reject the null hypothesis and conclude that there is a signicant difference between the mean productions of wheat when each of the different samples of fertilizers is used.This means that the farmer has to choose the fertilizer sample with the lowest variance and high average production of wheat (in bushels). From the variance table provided above, it is evident that the farmer can decide to use either fertilizer samples C or D because they have the lowest variability in mean production (in bushels) and the average production per acre is significantly high.Hide #QUESTION 2 crop F) fertilizer 5 1220 244.00 16 5.78e-07 * * * Residuals 24 366 15.25 Signif. codes: 0 '*#*' 0.001 /#*' 0.01 .*' 0.05 . .' 0.1 1
Step by Step Solution
There are 3 Steps involved in it

Get step-by-step solutions from verified subject matter experts