

Question: 1. Sketch Bode magnitude and frequency plot for the following transfer function, and compare it to the actual calculated values (30pts). H(s) 20s + 200
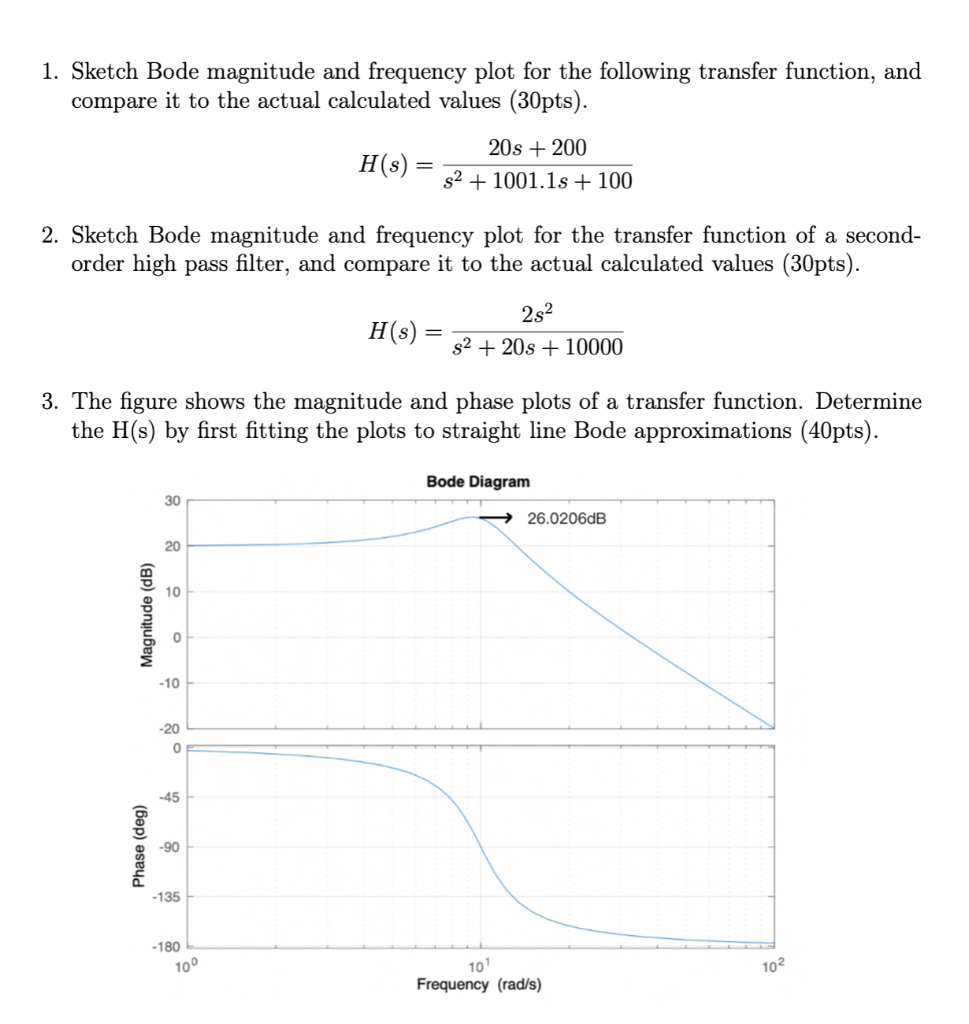
1. Sketch Bode magnitude and frequency plot for the following transfer function, and compare it to the actual calculated values (30pts). H(s) 20s + 200 S2 + 1001.1s +100 2. Sketch Bode magnitude and frequency plot for the transfer function of a second- order high pass filter, and compare it to the actual calculated values (30pts). H(S) = = 2s2 $2 + 20s + 10000 3. The figure shows the magnitude and phase plots of a transfer function. Determine the H(s) by first fitting the plots to straight line Bode approximations (40pts). Bode Diagram 30 26.0206dB 20 10 Magnitude (dB) 0 -10 -20 0 -45 Phase (deg) -90 -135 -180 10 102 101 Frequency (rad/s)
Step by Step Solution
There are 3 Steps involved in it

Get step-by-step solutions from verified subject matter experts