

Question: 1) Solve the Traveling Salesman Problem (TSP) using Genetic Algorithm. 2) Apply the algorithm with the following setting: a) Population of 40 chromosomes. b) Crossover
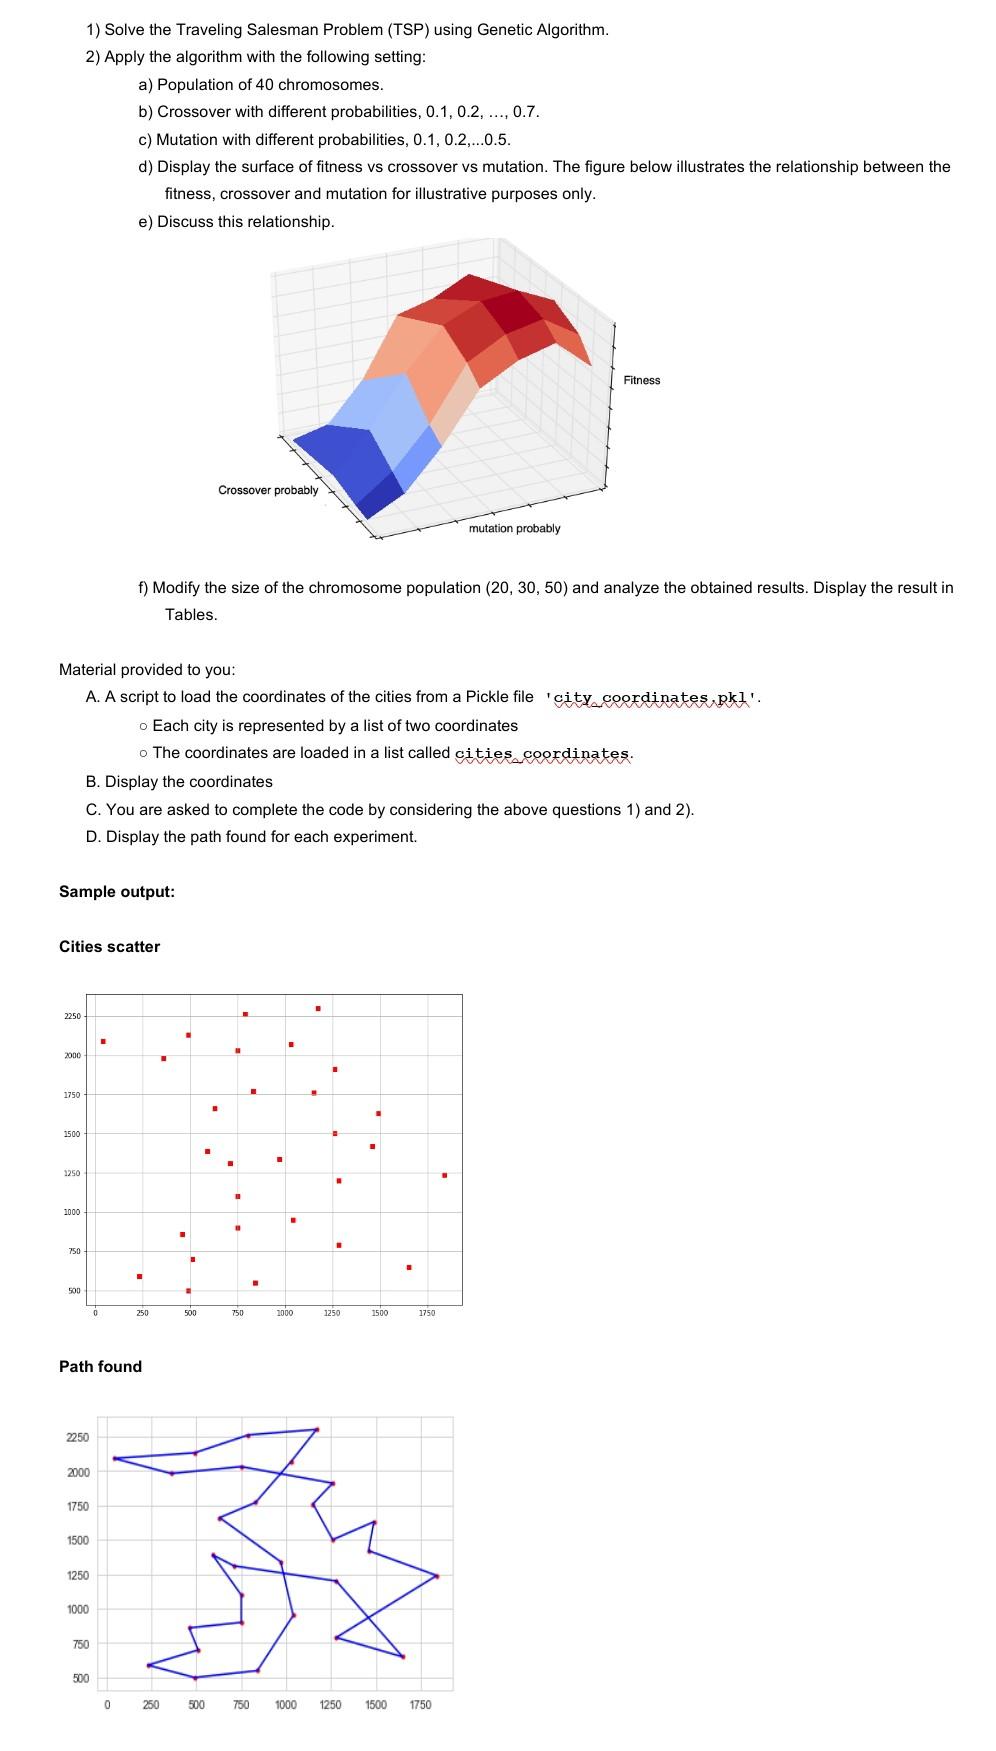
1) Solve the Traveling Salesman Problem (TSP) using Genetic Algorithm. 2) Apply the algorithm with the following setting: a) Population of 40 chromosomes. b) Crossover with different probabilities, 0.1, 0.2, ..., 0.7. c) Mutation with different probabilities, 0.1, 0.2,...0.5. d) Display the surface of fitness vs crossover vs mutation. The figure below illustrates the relationship between the fitness, crossover and mutation for illustrative purposes only. e) Discuss this relationship. Fitness Crossover probably mutation probably f) Modify the size of the chromosome population (20, 30, 50) and analyze the obtained results. Display the result in Tables. Material provided to you: A. A script to load the coordinates of the cities from a Pickle file 'city coordinates pkl'. o Each city is represented by a list of two coordinates o The coordinates are loaded in a list called cities, coordinates. B. Display the coordinates C. You are asked to complete the code by considering the above questions 1) and 2). D. Display the path found for each experiment. Sample output: Cities scatter 2250 2000 1750 . 1500 1250 1000 1 750 1 500 0 250 500 750 1000 1250 1500 1750 Path found 2250 2000 1750 1500 1250 1000 750 500 0 250 500 750 1000 1250 1500 1750 1) Solve the Traveling Salesman Problem (TSP) using Genetic Algorithm. 2) Apply the algorithm with the following setting: a) Population of 40 chromosomes. b) Crossover with different probabilities, 0.1, 0.2, ..., 0.7. c) Mutation with different probabilities, 0.1, 0.2,...0.5. d) Display the surface of fitness vs crossover vs mutation. The figure below illustrates the relationship between the fitness, crossover and mutation for illustrative purposes only. e) Discuss this relationship. Fitness Crossover probably mutation probably f) Modify the size of the chromosome population (20, 30, 50) and analyze the obtained results. Display the result in Tables. Material provided to you: A. A script to load the coordinates of the cities from a Pickle file 'city coordinates pkl'. o Each city is represented by a list of two coordinates o The coordinates are loaded in a list called cities, coordinates. B. Display the coordinates C. You are asked to complete the code by considering the above questions 1) and 2). D. Display the path found for each experiment. Sample output: Cities scatter 2250 2000 1750 . 1500 1250 1000 1 750 1 500 0 250 500 750 1000 1250 1500 1750 Path found 2250 2000 1750 1500 1250 1000 750 500 0 250 500 750 1000 1250 1500 1750
Step by Step Solution
There are 3 Steps involved in it

Get step-by-step solutions from verified subject matter experts