

Question: 1. solve using Mathlab Question 1: The following two functions are given below: y1=3x2+6x+7y2=9.8x+50 The x values range from - 10 to 10 to the
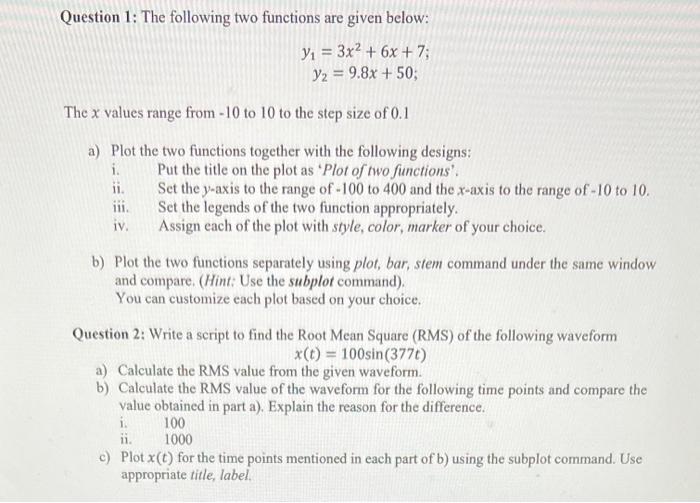
Question 1: The following two functions are given below: y1=3x2+6x+7y2=9.8x+50 The x values range from - 10 to 10 to the step size of 0.1 a) Plot the two functions together with the following designs: i. Put the title on the plot as 'Plot of two functions'. ii. Set the y-axis to the range of - 100 to 400 and the x-axis to the range of-10 to 10 . iii. Set the legends of the two function appropriately. iv. Assign each of the plot with style, color, marker of your choice. b) Plot the two functions separately using plot, bar, stem command under the same window and compare. (Hint: Use the subplot command). You can customize each plot based on your choice. Question 2: Write a script to find the Root Mean Square (RMS) of the following waveform x(t)=100sin(377t) a) Calculate the RMS value from the given waveform. b) Calculate the RMS value of the waveform for the following time points and compare the value obtained in part a). Explain the reason for the difference. i. 100 ii. 1000 c) Plot x(t) for the time points mentioned in each part of b) using the subplot command. Use appropriate title, label
Step by Step Solution
There are 3 Steps involved in it

Get step-by-step solutions from verified subject matter experts