

Question: 1) [StatCrunch] In the OECD data file, create a Scatter Plot of Economic Freedom ('Econ') as 'x', and Income Inequality ('Inequal') for 'y'. Overlay a
![1) [StatCrunch] In the OECD data file, create a Scatter Plot](https://dsd5zvtm8ll6.cloudfront.net/si.experts.images/questions/2024/11/672d9b5abcff2_138672d9b5aac8e3.jpg)
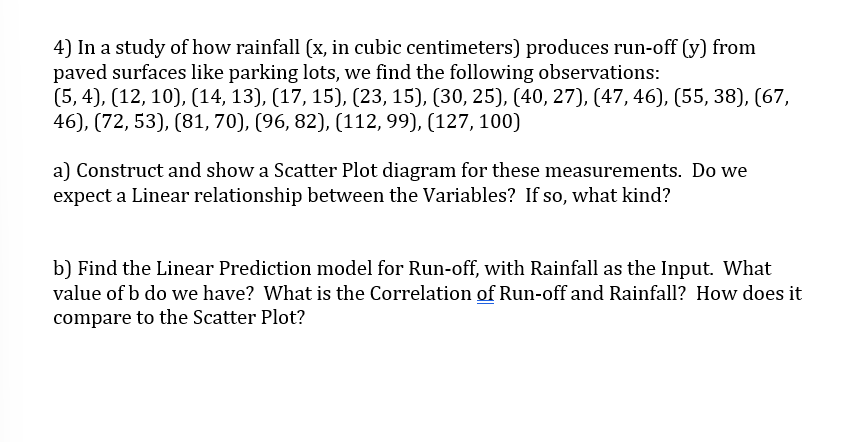
1) [StatCrunch] In the OECD data file, create a Scatter Plot of Economic Freedom ('Econ') as 'x', and Income Inequality ('Inequal') for 'y'. Overlay a polynomial of order 1 (a Best-fit line). What coefficients (a, b) do we get? How do we interpret a? How do we interpret b? Options Inequal 40 30 60 65 70 75 80 Econ4] In a study of how rainfall [x, in cubic centimeters] produces run-off [y] from paved surfaces like parking lots, we nd the following observations: [5, 4), [12, 10), [14, 13), [17, 15), (23, 15), [30,25], [40, 27), [47, 46), [55, 38), (67, 48), [72, 53), [81, 70), [96, 82), (112,89), [127, 100) 3] Construct and show a Scatter Plot diagram for these measurements. Do we expect a Linear relationship between the Variables? If so, what kind? b) Find the Linear Prediction model for Run-off, with Rainfall as the Input. What value of b do we have? What is the Correlation 11_f Run-off and Rainfall? How does it compare to the Scatter Plot
Step by Step Solution
There are 3 Steps involved in it

Get step-by-step solutions from verified subject matter experts