

Question: 1) Students decide to roll a ball between two hills and take measurements of its velocity. These measurements are plotted in the figure a) determine
1) Students decide to roll a ball between two hills and take measurements of its velocity. These measurements are plotted in the figure a) determine the average acceleration over the following time intervals: 0 to 3.0 s and 3.5s to 5.0s. b) determine the total displacement over the time interval 0 s to 7.0 s.
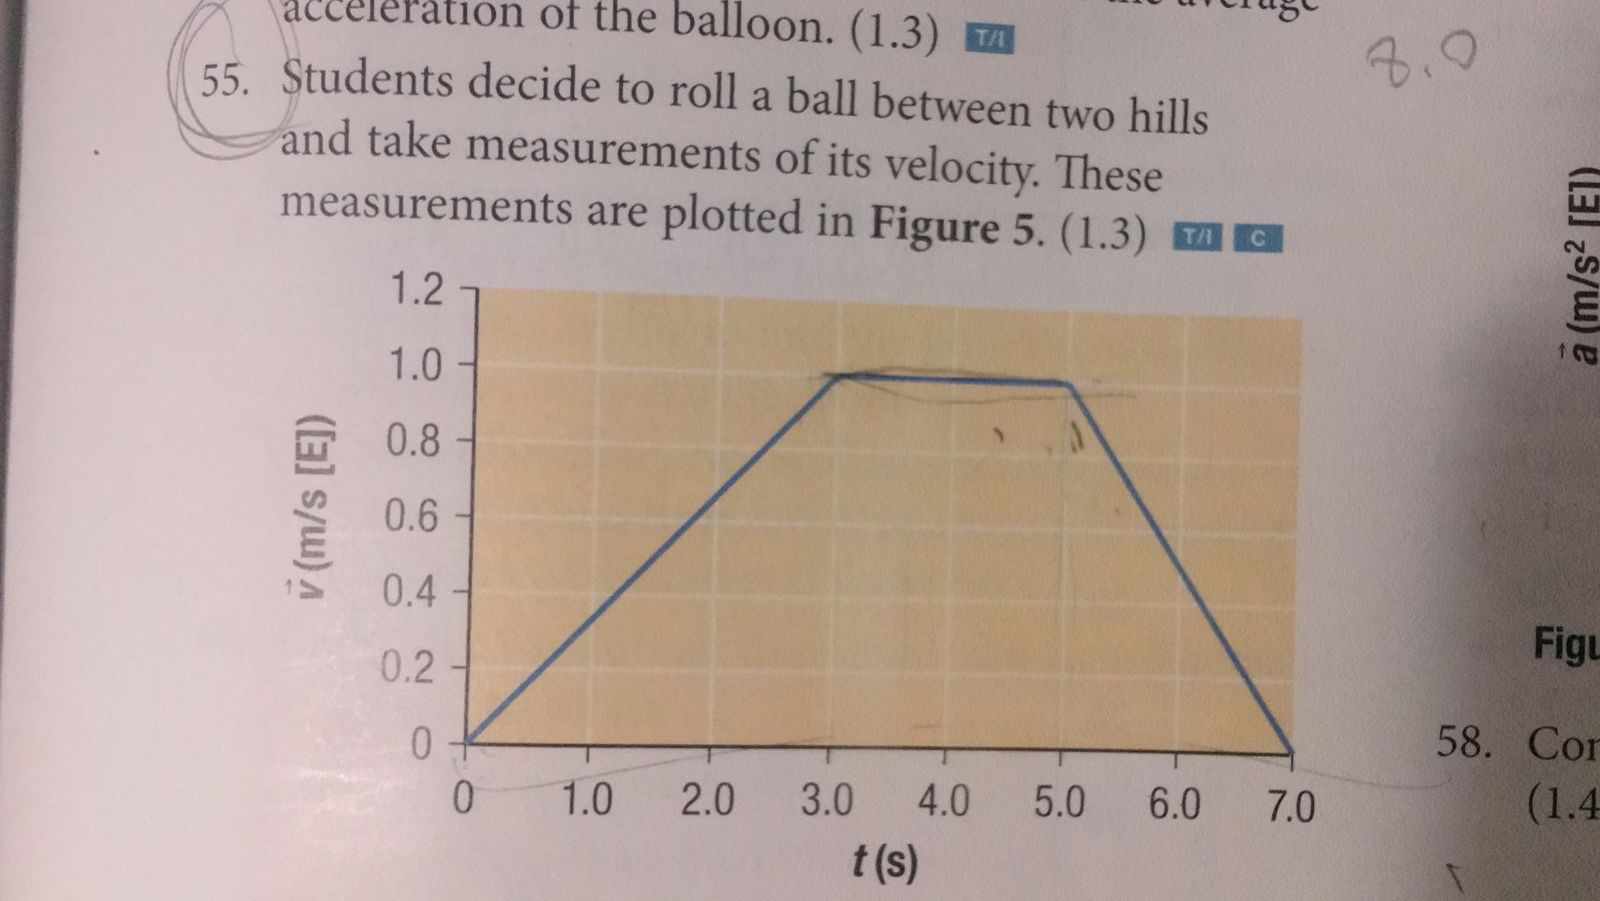
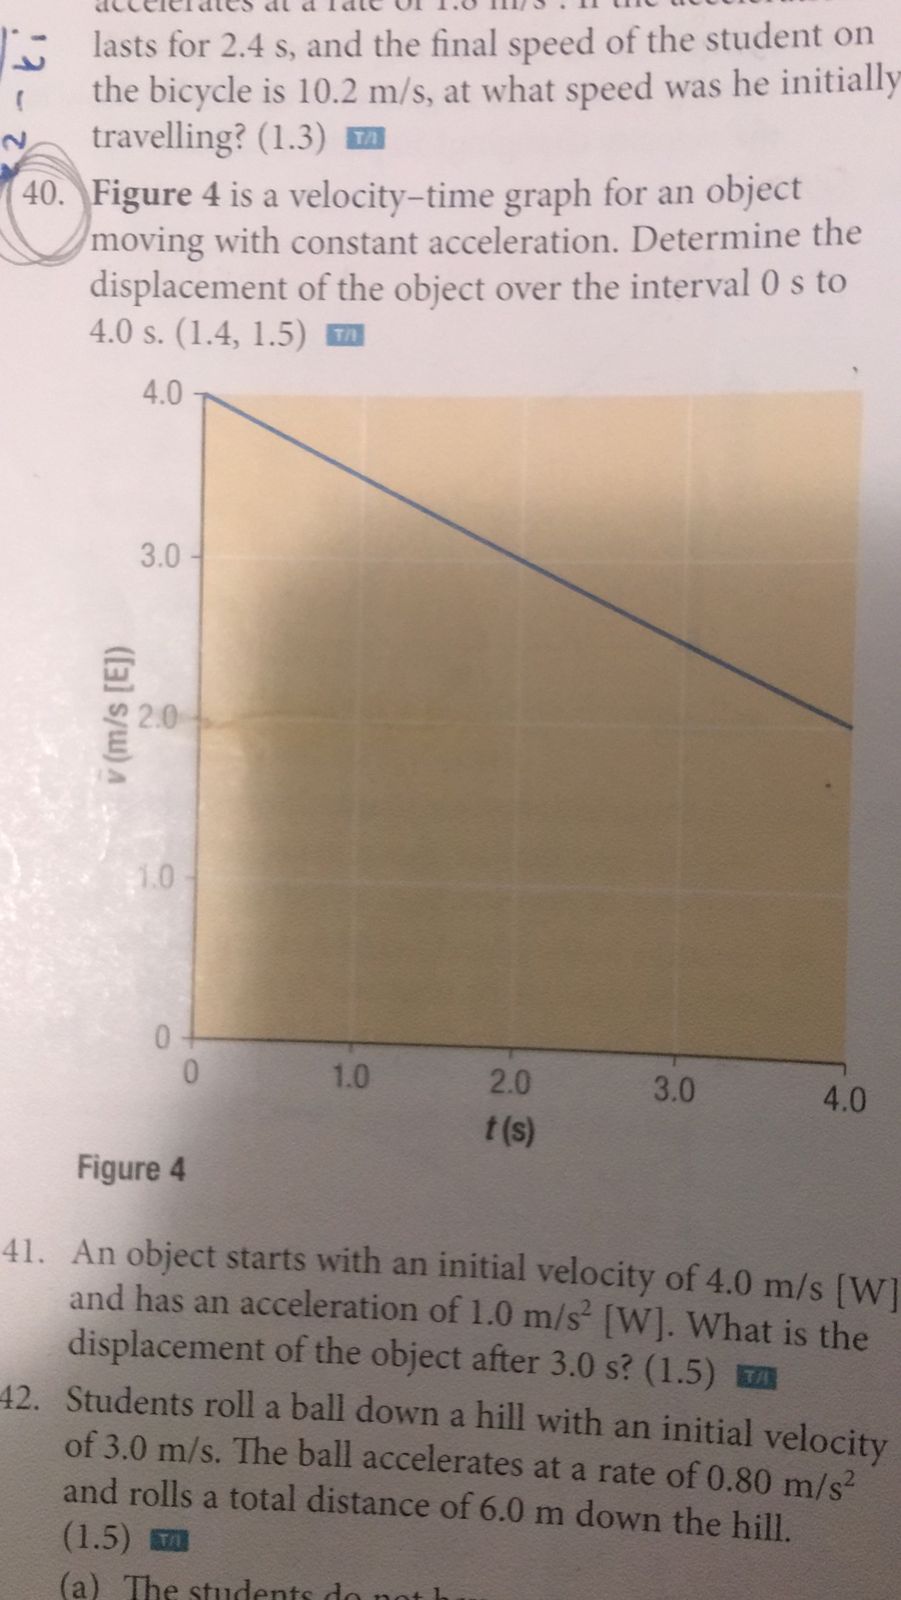
acceleration of the balloon. (1.3) T/ 8. 0 55. Students decide to roll a ball between two hills and take measurements of its velocity. These measurements are plotted in Figure 5. (1.3) T/1 C a (m/s2 [E]) 1.2 1.0 0.8 v (m/s [E]) 0.6 0.4 Fig 0.2 0 58. Com 0 1.0 2.0 3.0 4.0 5.0 6.0 7.0 (1.4 t (s)lasts for 2.4 s, and the final speed of the student on the bicycle is 10.2 m/s, at what speed was he initially travelling? (1.3) 40. Figure 4 is a velocity-time graph for an object moving with constant acceleration. Determine the displacement of the object over the interval 0 s to 4.0 s. (1.4, 1.5) TO 4.0 3.0 v (m/s [E]) 2.0 1.0 O 1.0 2.0 3.0 4.0 t (s) Figure 4 41. An object starts with an initial velocity of 4.0 m/s [W] and has an acceleration of 1.0 m/s' [W]. What is the displacement of the object after 3.0 s? (1.5) T 42. Students roll a ball down a hill with an initial velocity of 3.0 m/s. The ball accelerates at a rate of 0.80 m/s and rolls a total distance of 6.0 m down the hill. (1.5) WA (a) The stud
Step by Step Solution
There are 3 Steps involved in it

Get step-by-step solutions from verified subject matter experts