

Question: 1. Supply and Demand Schedules for Baseballs (76 points) Supply Schedule Price Quantity Supplied $3.00 $4.00 $5.00 $6.00 $7.00 25000 30000 35000 40000 45000
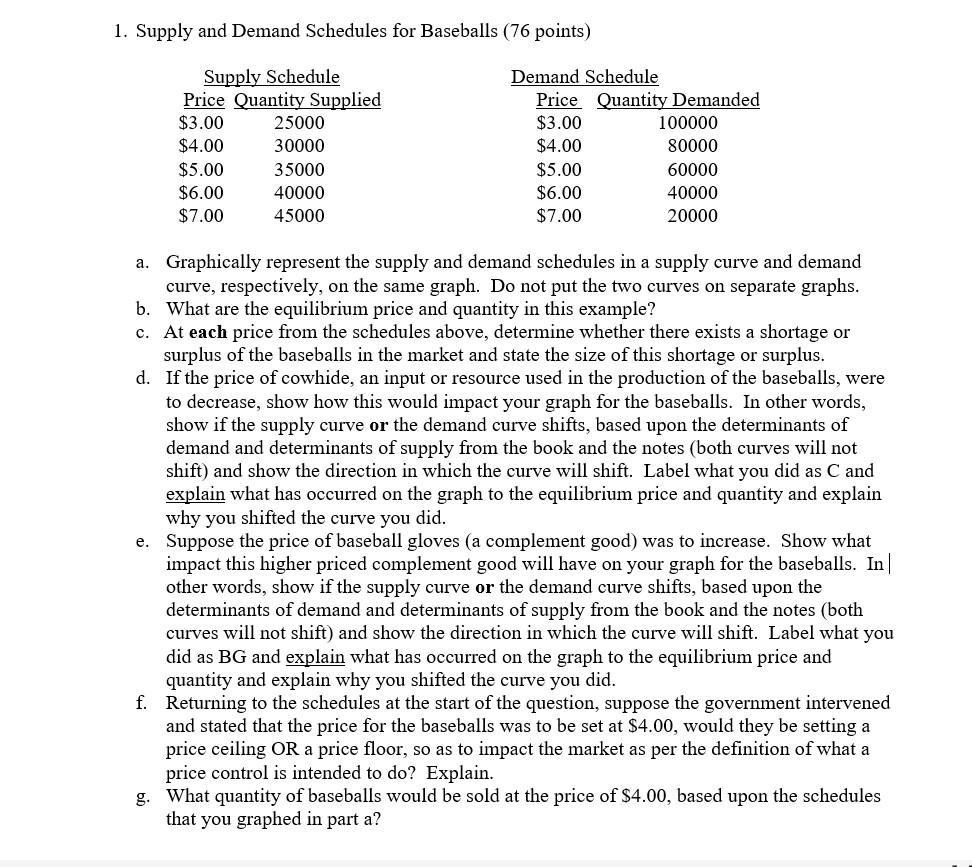
1. Supply and Demand Schedules for Baseballs (76 points) Supply Schedule Price Quantity Supplied $3.00 $4.00 $5.00 $6.00 $7.00 25000 30000 35000 40000 45000 Demand Schedule Price Quantity Demanded $3.00 $4.00 $5.00 $6.00 $7.00 100000 80000 60000 40000 20000 a. Graphically represent the supply and demand schedules in a supply curve and demand curve, respectively, on the same graph. Do not put the two curves on separate graphs. What are the equilibrium price and quantity in this example? b. c. At each price from the schedules above, determine whether there exists a shortage or surplus of the baseballs in the market and state the size of this shortage or surplus. d. If the price of cowhide, an input or resource used in the production of the baseballs, were to decrease, show how this would impact your graph for the baseballs. In other words, show if the supply curve or the demand curve shifts, based upon the determinants of demand and determinants of supply from the book and the notes (both curves will not shift) and show the direction in which the curve will shift. Label what you did as C and explain what has occurred on the graph to the equilibrium price and quantity and explain why you shifted the curve you did. e. Suppose the price of baseball gloves (a complement good) was to increase. Show what impact this higher priced complement good will have on your graph for the baseballs. In other words, show if the supply curve or the demand curve shifts, based upon the determinants of demand and determinants of supply from the book and the notes (both curves will not shift) and show the direction in which the curve will shift. Label what you did as BG and explain what has occurred on the graph to the equilibrium price and quantity and explain why you shifted the curve you did. f. Returning to the schedules at the start of the question, suppose the government intervened and stated that the price for the baseballs was to be set at $4.00, would they be setting a price ceiling OR a price floor, so as to impact the market as per the definition of what a price control is intended to do? Explain. g. What quantity of baseballs would be sold at the price of $4.00, based upon the schedules that you graphed in part a? 1. Supply and Demand Schedules for Baseballs (76 points) Supply Schedule Price Quantity Supplied $3.00 $4.00 $5.00 $6.00 $7.00 25000 30000 35000 40000 45000 Demand Schedule Price Quantity Demanded $3.00 $4.00 $5.00 $6.00 $7.00 100000 80000 60000 40000 20000 a. Graphically represent the supply and demand schedules in a supply curve and demand curve, respectively, on the same graph. Do not put the two curves on separate graphs. What are the equilibrium price and quantity in this example? b. c. At each price from the schedules above, determine whether there exists a shortage or surplus of the baseballs in the market and state the size of this shortage or surplus. d. If the price of cowhide, an input or resource used in the production of the baseballs, were to decrease, show how this would impact your graph for the baseballs. In other words, show if the supply curve or the demand curve shifts, based upon the determinants of demand and determinants of supply from the book and the notes (both curves will not shift) and show the direction in which the curve will shift. Label what you did as C and explain what has occurred on the graph to the equilibrium price and quantity and explain why you shifted the curve you did. e. Suppose the price of baseball gloves (a complement good) was to increase. Show what impact this higher priced complement good will have on your graph for the baseballs. In other words, show if the supply curve or the demand curve shifts, based upon the determinants of demand and determinants of supply from the book and the notes (both curves will not shift) and show the direction in which the curve will shift. Label what you did as BG and explain what has occurred on the graph to the equilibrium price and quantity and explain why you shifted the curve you did. f. Returning to the schedules at the start of the question, suppose the government intervened and stated that the price for the baseballs was to be set at $4.00, would they be setting a price ceiling OR a price floor, so as to impact the market as per the definition of what a price control is intended to do? Explain. g. What quantity of baseballs would be sold at the price of $4.00, based upon the schedules that you graphed in part a?
Step by Step Solution
3.47 Rating (154 Votes )
There are 3 Steps involved in it

Get step-by-step solutions from verified subject matter experts