

Question: 1 Suppose the Excel output from the baseball data includes this ANOVA table: ANOVA d 35 MS F S n' icance F Regression 1 3471
1
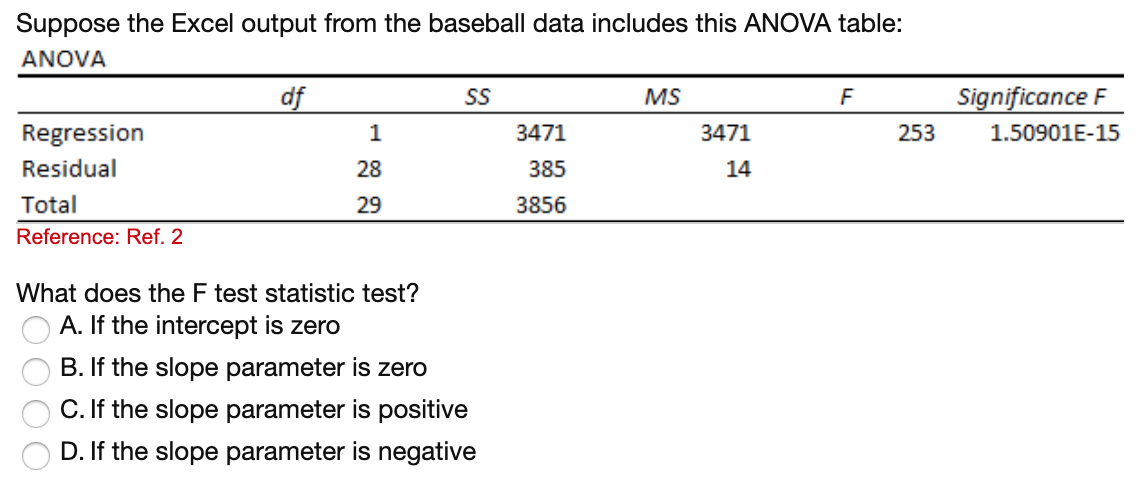
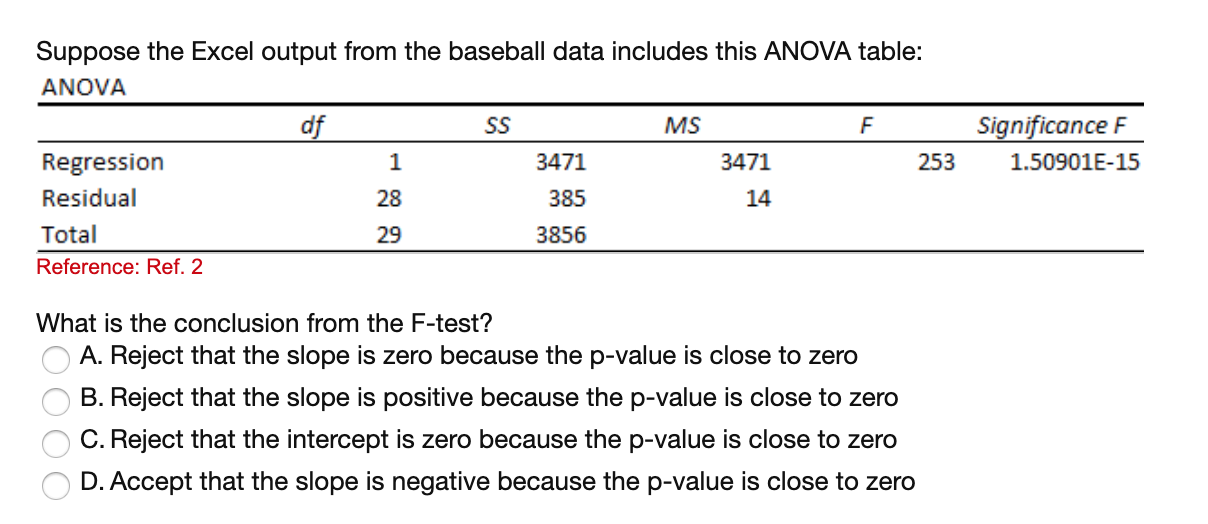
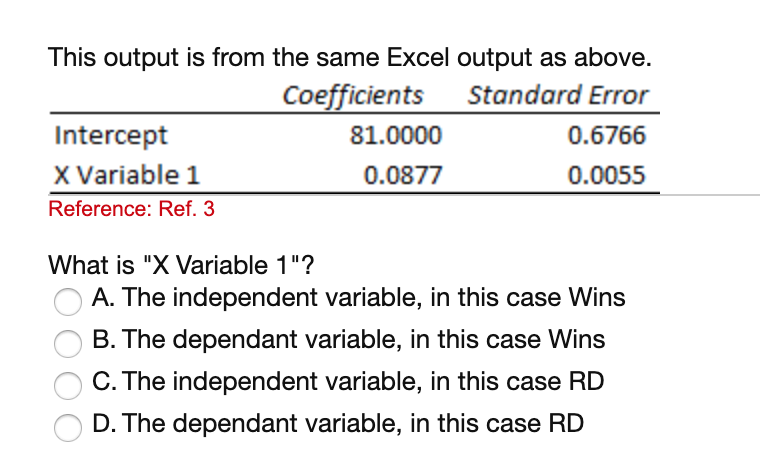
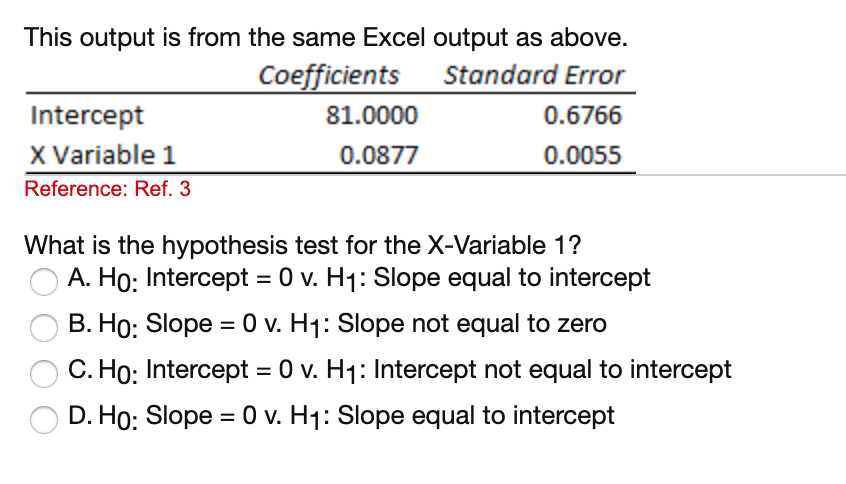
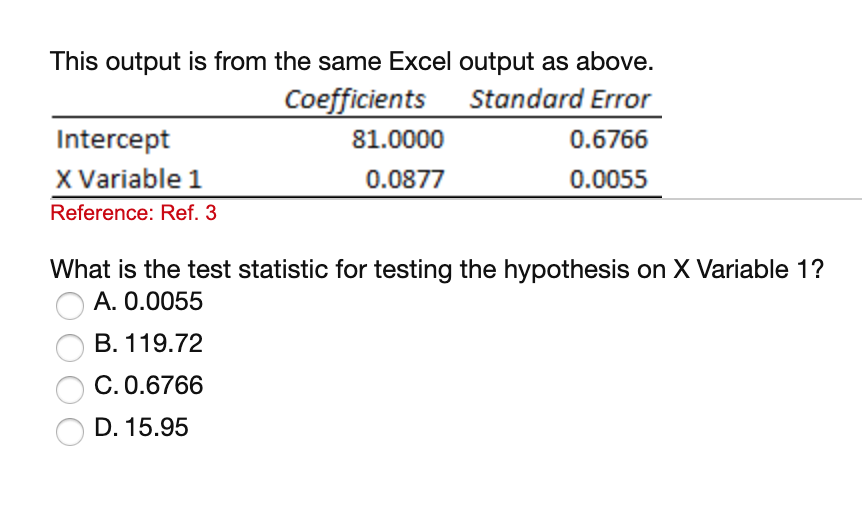
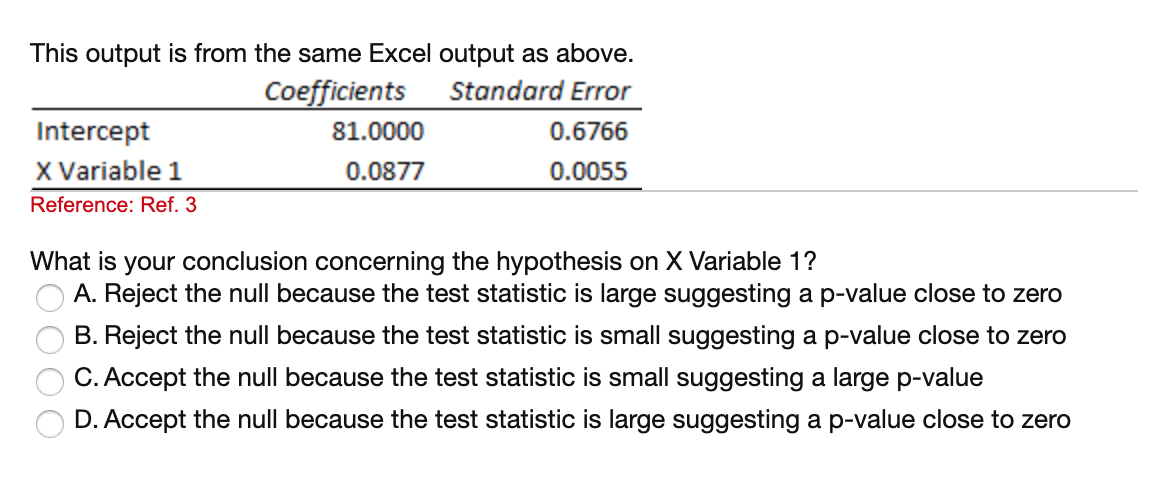
Suppose the Excel output from the baseball data includes this ANOVA table: ANOVA d 35 MS F S\" n' icance F Regression 1 3471 3471 253 1.50901E-15 Residual 28 385 14 Total 29 3856 Reference: Ref. 2 What does the F test statistic test? f) A. If the intercept is zero f\") B. If the slope parameter is zero 0 C. If the slope parameter is positive f\") D. If the slope parameter is negative Suppose the Excel output from the baseball data includes this ANOVA table: ANOVA df 55 MS F Significance F Regression 1 3471 3471 253 1.50901E15 Residual 28 385 14 Total 29 3856 Reference: Ref. 2 What is the conclusion from the F-test? ('7 A. Reject that the slope is zero because the p-value is close to zero .('7. B. Reject that the slope is positive because the p-value is close to zero .('7 C. Reject that the intercept is zero because the p-value is close to zero .('7. D. Accept that the slope is negative because the p-value is close to zero This output is from the same Excel output as above. Coefficients Standard Error Intercept 81.0000 0.6766 X Variable 1 0.0877 0.0055 Reference: Ref. 3 What is "X Variable 1"? A. The independent variable, in this case Wins O B. The dependant variable, in this case Wins C. The independent variable, in this case RD O D. The dependant variable, in this case RDThis output is from the same Excel output as above. Coefficients Standard Error Intercept 81.0000 0.6766 X Variable 1 0.0877 0.0055 Reference: Ref. 3 What is the hypothesis test for the X-Variable 1? A. Ho: Intercept = 0 v. H1: Slope equal to intercept O B. Ho: Slope = 0 v. H1: Slope not equal to zero C. Ho: Intercept = 0 v. H1: Intercept not equal to intercept D. Ho: Slope = 0 v. H1: Slope equal to interceptThis output is from the same Excel output as above. Coefficients Standard Error Intercept 81.0000 0.6766 X Variable 1 0.0877 0.0055 Reference: Ref. 3 What is the test statistic for testing the hypothesis on X Variable 1? A. 0.0055 O B. 119.72 C. 0.6766 D. 15.95This output is from the same Excel output as above. Coeicief nts Standard Error Intercept 81.0000 0.6766 x Variable 1 0.0877 0.0055 Reference: Ref. 3 What is your conclusion concerning the hypothesis on X Variable 1? ('j A. Reject the null because the test statistic is large suggesting a pvalue close to zero if) B. Reject the null because the test statistic is small suggesting a p-value close to zero f) 0. Accept the null because the test statistic is small suggesting a large p-value C D. Accept the null because the test statistic is large suggesting a p-Value close to zero
Step by Step Solution
There are 3 Steps involved in it

Get step-by-step solutions from verified subject matter experts