Question: 1. Table 1 below shows data taken from the 2012 Statistics South Africa Generai Household Survey for two of South Africa's provinces and for South
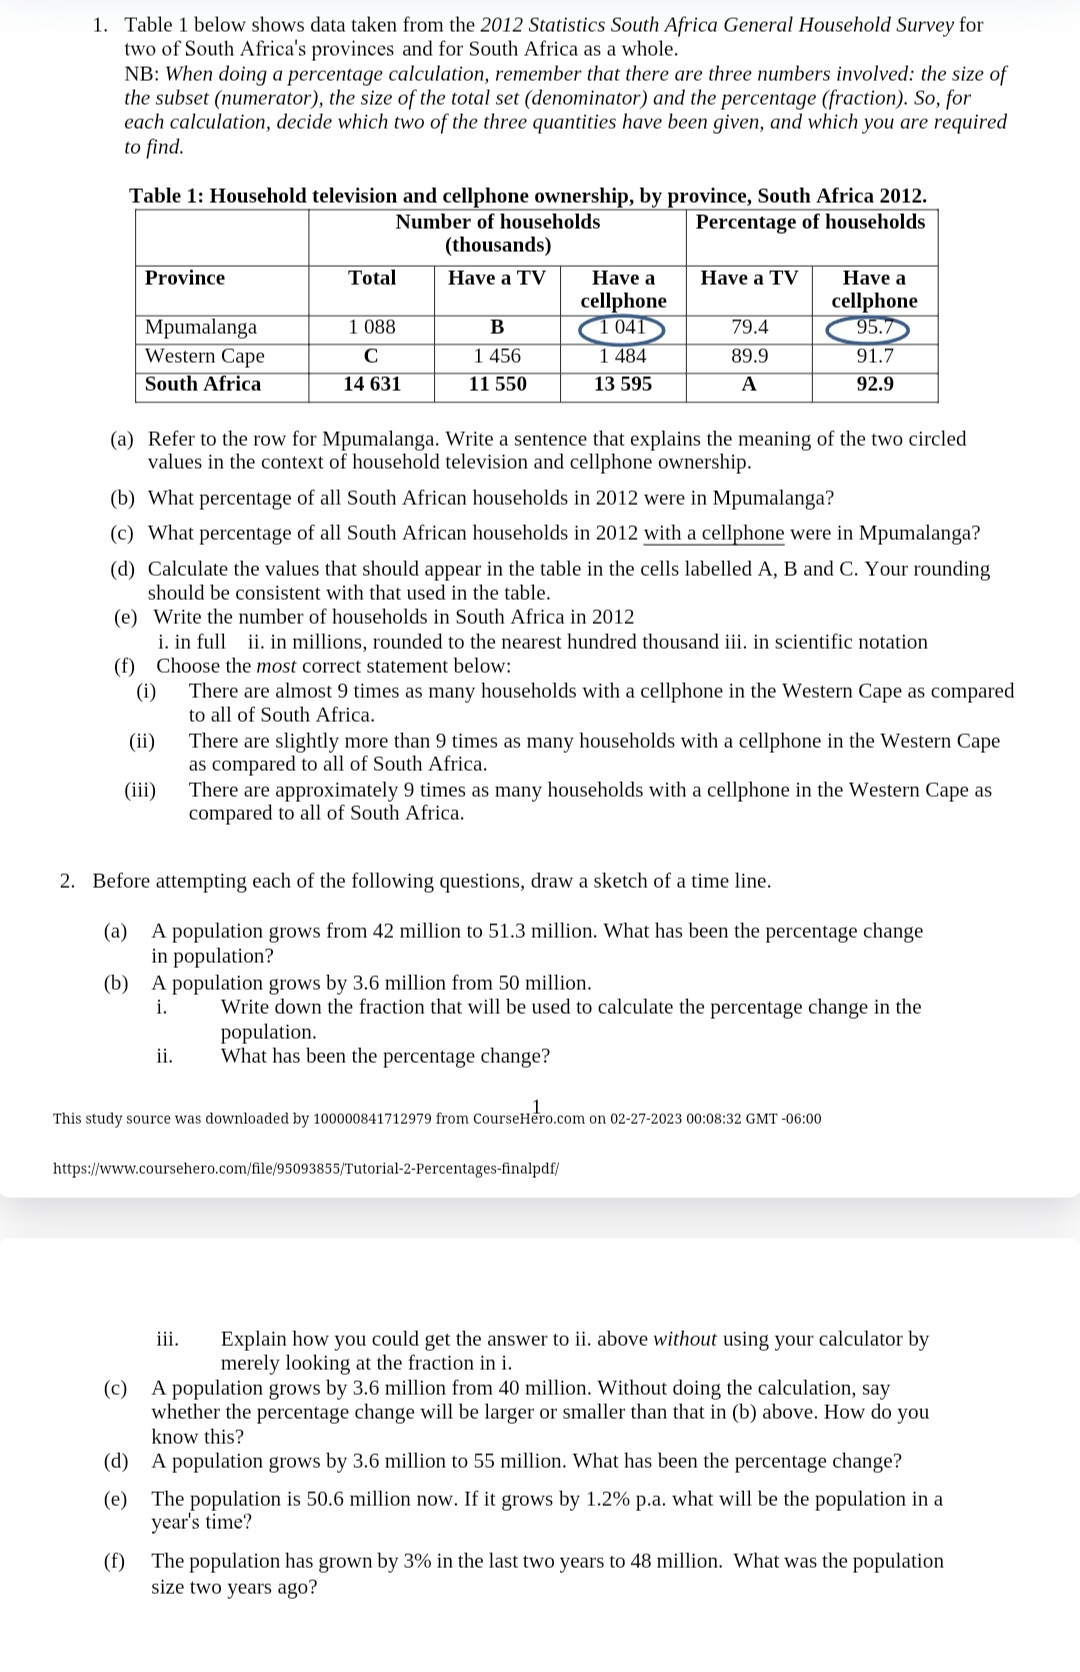
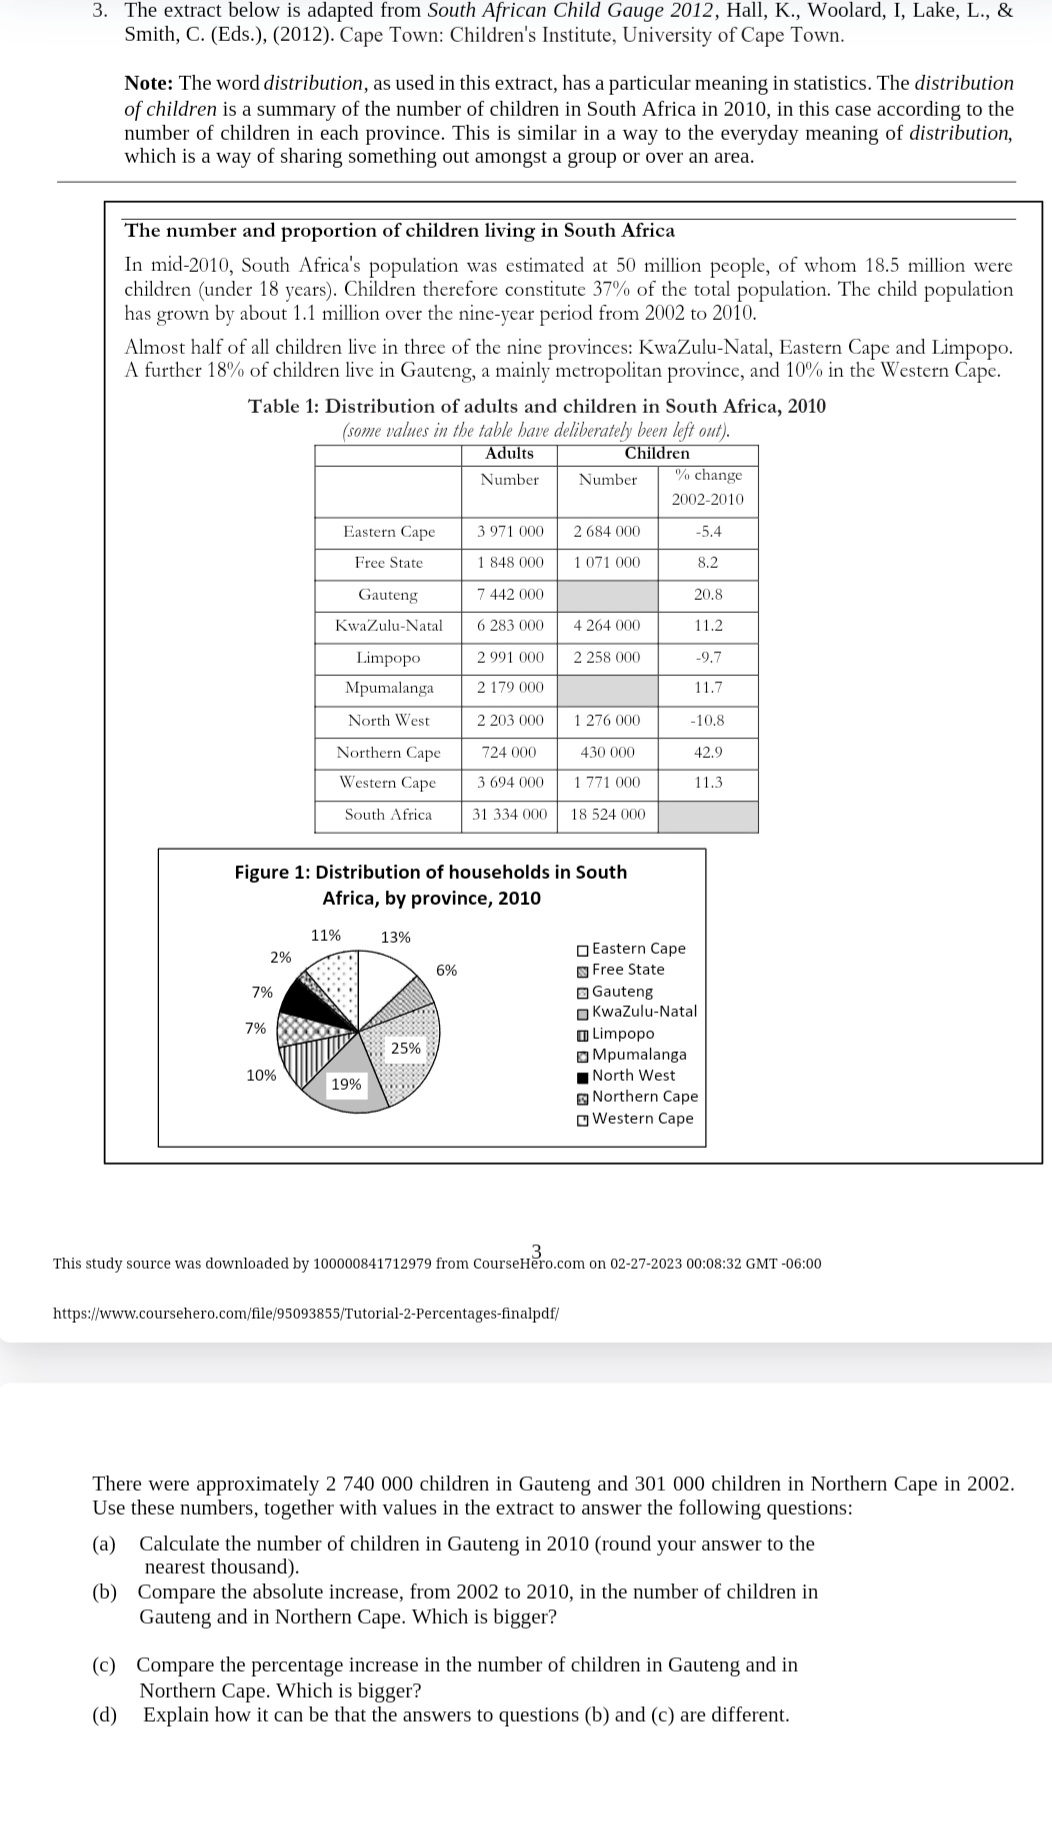
1. Table 1 below shows data taken from the 2012 Statistics South Africa Generai Household Survey for two of South Africa's provinces and for South Africa as a whole. NB: When doing a percentage calculation, remember that there are three numbers involved: the size of the subset (numerator), the size of the totai set (denominator) and the percentage (fraction ). So, for each calculation, decide which two of the three quantities have been given, and which you are required to find. Table 1: Household television and cellphone ownership, by province, South Africa 2012. Number of households Percentage of households (thousands) Province Have a Have a TV Have a cellphone cellphone Mpumalanga 1 088 B m. 79.4 w Western Cape C 1 455 1 484 89.9 | 91.7 South Africa 14 631 11 550 13 595 A | 92.9 | (a) Refer to the row for Mpumalanga. Write a sentence that explains the meaning of the two circled values in the context of household television and cellphone ownership. (b) What percentage of all South African households in 2012 were in Mpumalanga? (c) What percentage of all South African households in 2012 with a cellphone were in Mpumalanga? (d) Calculate the values that should appear in the table in the cells labelled A, B and C. Your rounding should be consistent with that used in the table. (e) Write the number of households in South Africa in 2012 i. in full ii. in millions, rounded to the nearest hundred thousand iii. in scientific notation (f) Choose the most correct statement below: (i) There are almost 9 times as many households with a cellphone in the Western Cape as compared to all of South Africa. (ii) There are slightly more than 9 times as many households with a cellphone in the Western Cape as compared to all of South Africa. (iii) There are approximately 9 times as many households with a cellphone in the Western Cape as compared to all of South Africa. 2. Before attempting each of the following questions, draw a sketch of a time line. [a] A population grows from 42 million to 51.3 million. What has been the percentage change in population? (b) A population groWs by 3.6 million from 50 million. i. Write down the fraction that will be used to calculate the percentage change in the population. ii. What has been the percentage change? _ 1 This study source was downloaded by 100000841?12979 from CourseHero.com on 02-2?-2023 00:08:32 GMT -06:00 https:iitttrwwazoursehero.coI'nil#95093355iTutortal-z-Percentttges-nalpdr iii. Explain how you could get the answer to ii. above without using your calculator by merely looking at the fraction in i. [c] A population groWs by 3.6 million from 40 million. Without doing the calculation, say whether the percentage change will be larger or smaller than that in (b) above. How do you know this? (cl) A population groWs by 3.6 million to 55 million. What has been the percentage change? [e] The population is 50.6 million now. If it grows by 1.2% p.a. what will be the population in a year's time? (f) The population has grown by 3% in the last two years to 48 million. What was the population size two years ago? 3. The extract below is adapted from South African Child Gau Id Gauge 2012, Hall, K., Woolard, I, Lake, L., & Smith, C. (Eds.), (2012). Cape Town: Children's Institute, University of Cape Town. Note: The word distribution, as used in this extract, has a particular meaning in statistics. The distribution of children is a summary of the number of children in South Africa in 2010, in this case according to the number of children in each province. This is similar in a way to the everyday meaning of distribution, which is a way of sharing something out amongst a group or over an area. The number and proportion of children living in South Africa In mid-2010, South Africa's population was estimated at 50 million people, of whom 18.5 million were children (under 18 years). Children therefore constitute 37% of the total population. The child population has grown by about 1.1 million over the nine-year period from 2002 to 2010. Almost half of all children live in three of the nine provinces: KwaZulu-Natal, Eastern Cape and Limpopo. A further 18% of children live in Gauteng, a mainly metropolitan province, and 10% in the Western Cape. Table 1: Distribution of adults and children in South Africa, 2010 some values in the table have deliberately been left out) Adults Children Number Number To change 2002-2010 Eastern Cape 3 971 000 2 684 000 -5.4 Free State 1 848 000 1 071 000 8.2 Gauteng 7 442 000 20.8 KwaZulu-Natal 6 283 000 4 264 000 11.2 Limpopo 2 991 000 2 258 000 .97 Mpumalanga 2 179 000 11.7 North West 2 203 000 276 000 10.8 Northern Cape 724 000 430 000 42.9 Western Cape 3 694 000 771 000 11.3 South Africa 31 334 000 18 524 000 Figure 1: Distribution of households in South Africa, by province, 2010 11% 13% 2% Eastern Cape 6% Free State 7% Gauteng KwaZulu-Natal 7% " Limpopo 25% Mpumalanga 10% 19% North West Northern Cape y Western Cape This study source was downloaded by 100000841712979 from CourseHero.com on 02-27-2023 00:08:32 GMT -06:00 https://www.coursehero.com/file/95093855/Tutorial-2-Percentages-finalpdf/ There were approximately 2 740 000 children in Gauteng and 301 000 children in Northern Cape in 2002. Use these numbers, together with values in the extract to answer the following questions: (a) Calculate the number of children in Gauteng in 2010 (round your answer to the nearest thousand). (b) Compare the absolute increase, from 2002 to 2010, in the number of children in Gauteng and in Northern Cape. Which is bigger? (c) Compare the percentage increase in the number of children in Gauteng and in Northern Cape. Which is bigger? (d) Explain how it can be that the answers to questions (b) and (c) are different
Step by Step Solution
There are 3 Steps involved in it
1 Expert Approved Answer
Step: 1 Unlock
Question Has Been Solved by an Expert!
Get step-by-step solutions from verified subject matter experts
Step: 2 Unlock
Step: 3 Unlock
Students Have Also Explored These Related Mathematics Questions!