Question: 1. Table E6-1 on the following page shows the reported prevalence and incidence of HIV/AIDS in the United States during 2009. Dividing the prevalence of
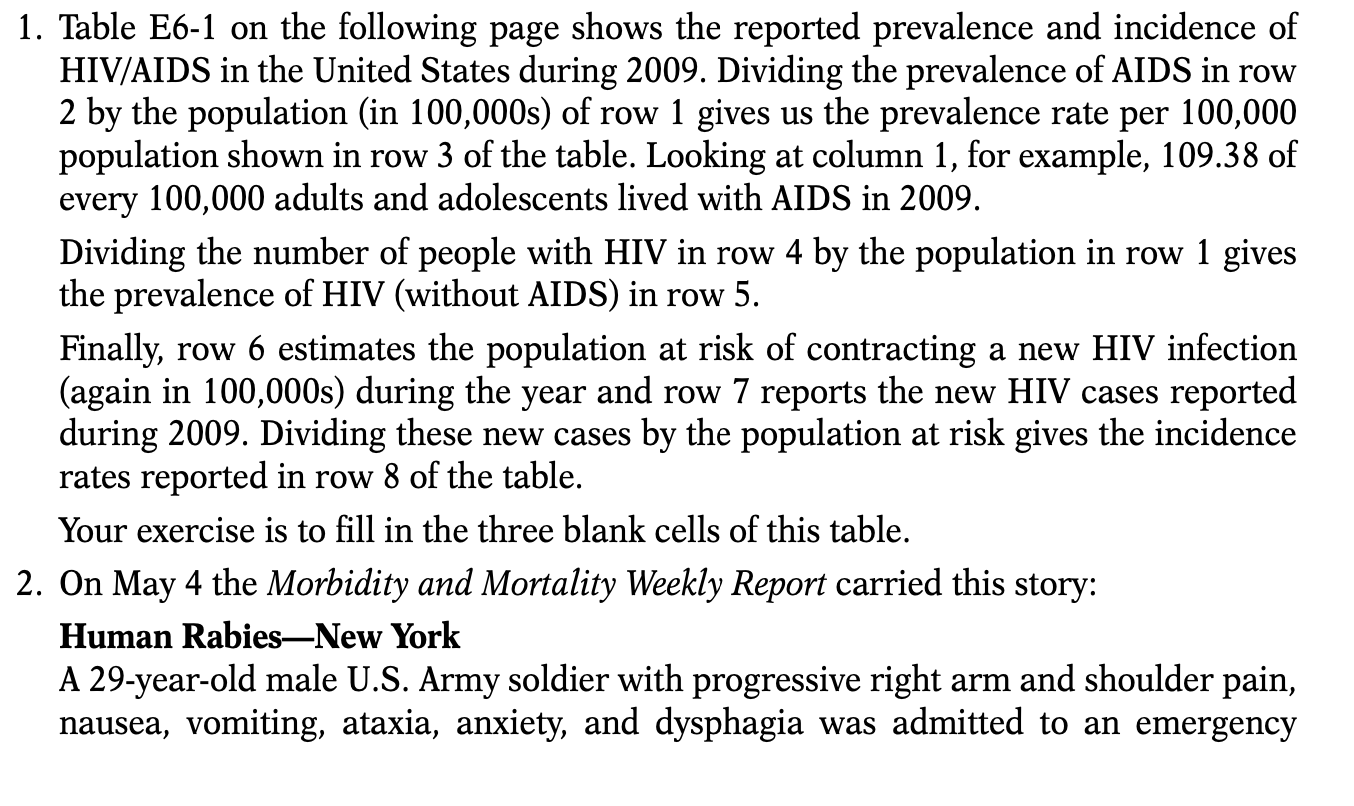
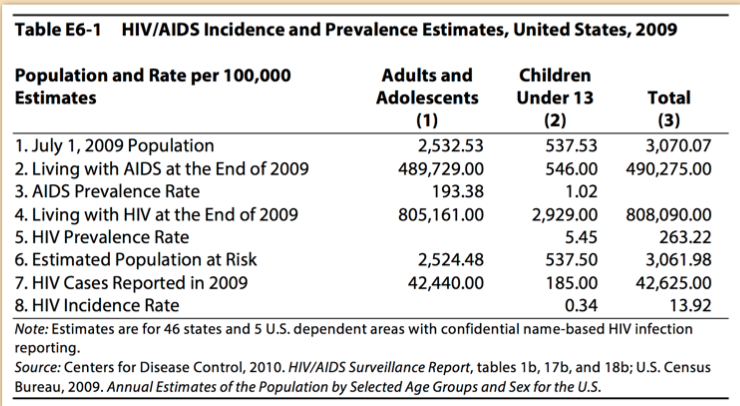
1. Table E6-1 on the following page shows the reported prevalence and incidence of HIV/AIDS in the United States during 2009. Dividing the prevalence of AIDS in row 2 by the population (in 100,000s) of row 1 gives us the prevalence rate per 100,000 population shown in row 3 of the table. Looking at column 1, for example, 109.38 of every 100,000 adults and adolescents lived with AIDS in 2009. Dividing the number of people with HIV in row 4 by the population in row 1 gives the prevalence of HIV (without AIDS) in row 5. Finally, row 6 estimates the population at risk of contracting a new HIV infection (again in 100,000s) during the year and row 7 reports the new HIV cases reported during 2009. Dividing these new cases by the population at risk gives the incidence rates reported in row 8 of the table. Your exercise is to fill in the three blank cells of this table. 2. On May 4 the Morbidity and Mortality Weekly Report carried this story: Human Rabies-New York A 29-year-old male U.S. Army soldier with progressive right arm and shoulder pain, nausea, vomiting, ataxia, anxiety, and dysphagia was admitted to an emergency department (ED) in New York for suspected rabies. An Afghanistan canine rabies virus variant was identified. The patient underwent an experimental treatment pro- tocol but died on August 31. From the most recent life table (use Table E5-1 of the previous chapter), how many years of life were lost due to this single death? YLL = Table E6-1 HIV/AIDS Incidence and Prevalence Estimates, United States, 2009 Population and Rate per 100,000 Adults and Children Estimates Adolescents Under 13 Total (1) (2) (3) 1.July 1, 2009 Population 2,532.53 537.53 3,070.07 2. Living with AIDS at the End of 2009 489,729.00 546.00 490,275.00 3. AIDS Prevalence Rate 193.38 1.02 4. Living with HIV at the End of 2009 805,161.00 2,929.00 808,090.00 5. HIV Prevalence Rate 5.45 263.22 6. Estimated Population at Risk 2,524.48 537.50 3,061.98 7. HIV Cases Reported in 2009 42,440.00 185.00 42,625.00 8. HIV Incidence Rate 0.34 13.92 Note: Estimates are for 46 states and 5 U.S. dependent areas with confidential name-based HIV infection reporting. Source: Centers for Disease Control, 2010. HIV/AIDS Surveillance Report, tables 1b, 17b, and 18b; U.S. Census Bureau, 2009. Annual Estimates of the population by Selected Age Groups and Sex for the U.S. 1. Table E6-1 on the following page shows the reported prevalence and incidence of HIV/AIDS in the United States during 2009. Dividing the prevalence of AIDS in row 2 by the population (in 100,000s) of row 1 gives us the prevalence rate per 100,000 population shown in row 3 of the table. Looking at column 1, for example, 109.38 of every 100,000 adults and adolescents lived with AIDS in 2009. Dividing the number of people with HIV in row 4 by the population in row 1 gives the prevalence of HIV (without AIDS) in row 5. Finally, row 6 estimates the population at risk of contracting a new HIV infection (again in 100,000s) during the year and row 7 reports the new HIV cases reported during 2009. Dividing these new cases by the population at risk gives the incidence rates reported in row 8 of the table. Your exercise is to fill in the three blank cells of this table. 2. On May 4 the Morbidity and Mortality Weekly Report carried this story: Human Rabies-New York A 29-year-old male U.S. Army soldier with progressive right arm and shoulder pain, nausea, vomiting, ataxia, anxiety, and dysphagia was admitted to an emergency department (ED) in New York for suspected rabies. An Afghanistan canine rabies virus variant was identified. The patient underwent an experimental treatment pro- tocol but died on August 31. From the most recent life table (use Table E5-1 of the previous chapter), how many years of life were lost due to this single death? YLL = Table E6-1 HIV/AIDS Incidence and Prevalence Estimates, United States, 2009 Population and Rate per 100,000 Adults and Children Estimates Adolescents Under 13 Total (1) (2) (3) 1.July 1, 2009 Population 2,532.53 537.53 3,070.07 2. Living with AIDS at the End of 2009 489,729.00 546.00 490,275.00 3. AIDS Prevalence Rate 193.38 1.02 4. Living with HIV at the End of 2009 805,161.00 2,929.00 808,090.00 5. HIV Prevalence Rate 5.45 263.22 6. Estimated Population at Risk 2,524.48 537.50 3,061.98 7. HIV Cases Reported in 2009 42,440.00 185.00 42,625.00 8. HIV Incidence Rate 0.34 13.92 Note: Estimates are for 46 states and 5 U.S. dependent areas with confidential name-based HIV infection reporting. Source: Centers for Disease Control, 2010. HIV/AIDS Surveillance Report, tables 1b, 17b, and 18b; U.S. Census Bureau, 2009. Annual Estimates of the population by Selected Age Groups and Sex for the U.S


