

Question: 1 . Table I show the data on pull strength analysis of golden wire in semiconductor industry ( with two independent variables ( x
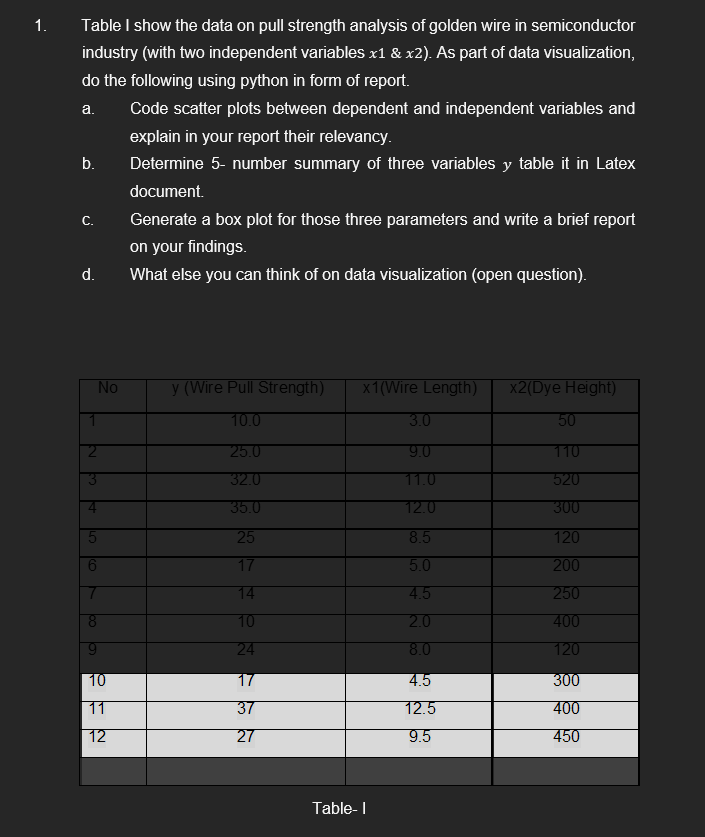
Table I show the data on pull strength analysis of golden wire in semiconductor industry with two independent variables x & x As part of data visualization, do the following using python in form of report.
a Code scatter plots between dependent and independent variables and explain in your report their relevancy.
b Determine number summary of three variables y table it in Latex document.
c Generate a box plot for those three parameters and write a brief report on your findings.
d What else you can think of on data visualization open question
Table I
Step by Step Solution
There are 3 Steps involved in it
1 Expert Approved Answer
Step: 1 Unlock

Question Has Been Solved by an Expert!
Get step-by-step solutions from verified subject matter experts
Step: 2 Unlock
Step: 3 Unlock