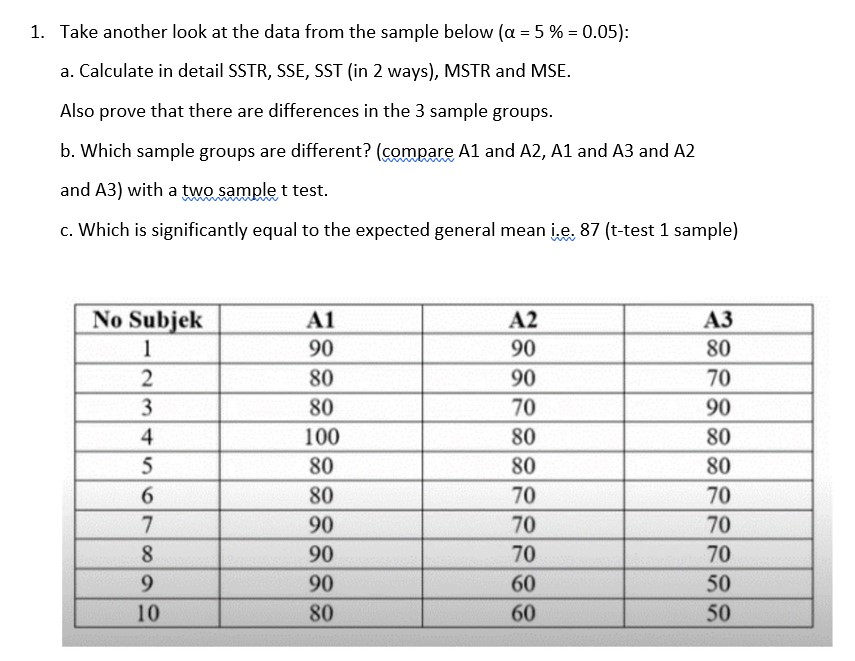
Question: 1. Take another look at the data from the sample below (a = 5 % = 0.05): a. Calculate in detail SSTR, SSE, SST (in

1. Take another look at the data from the sample1. Take another look at the data from the sample
1. Take another look at the data from the sample below (a = 5 % = 0.05): a. Calculate in detail SSTR, SSE, SST (in 2 ways), MSTR and MSE. Also prove that there are differences in the 3 sample groups. b. Which sample groups are different? (compare Al and A2, Al and A3 and A2 and A3) with a two sample t test. c. Which is significantly equal to the expected general mean i.e. 87 (t-test 1 sample) No Subjek A1 A2 A3 1 90 90 80 80 90 70 80 70 90 100 80 80 80 80 80 OOO J Q UI A W N 80 70 70 90 70 70 90 70 70 90 60 50 10 80 60 502. Being tested the effect of 3 kinds of medical glue formula on the time of wound closure with the following data : Formula a 13 10 8 11 8 Formula b 13 11 14 14 Formula c 4 1 3 4 2 4 Calculate in detail SSTR, SSE, SST (in 2 ways), MSTR and MSE. Look for Is there a difference between the 3 sample groups

Step by Step Solution

There are 3 Steps involved in it

1 Expert Approved Answer
Step: 1 Unlock blur-text-image
Question Has Been Solved by an Expert!

Get step-by-step solutions from verified subject matter experts

Step: 2 Unlock
Step: 3 Unlock

Students Have Also Explored These Related Accounting Questions!