

Question: 1. The 200 students tested represent a random sample taken from the pop- ulation of all college students. Now suppose we want to estimate the
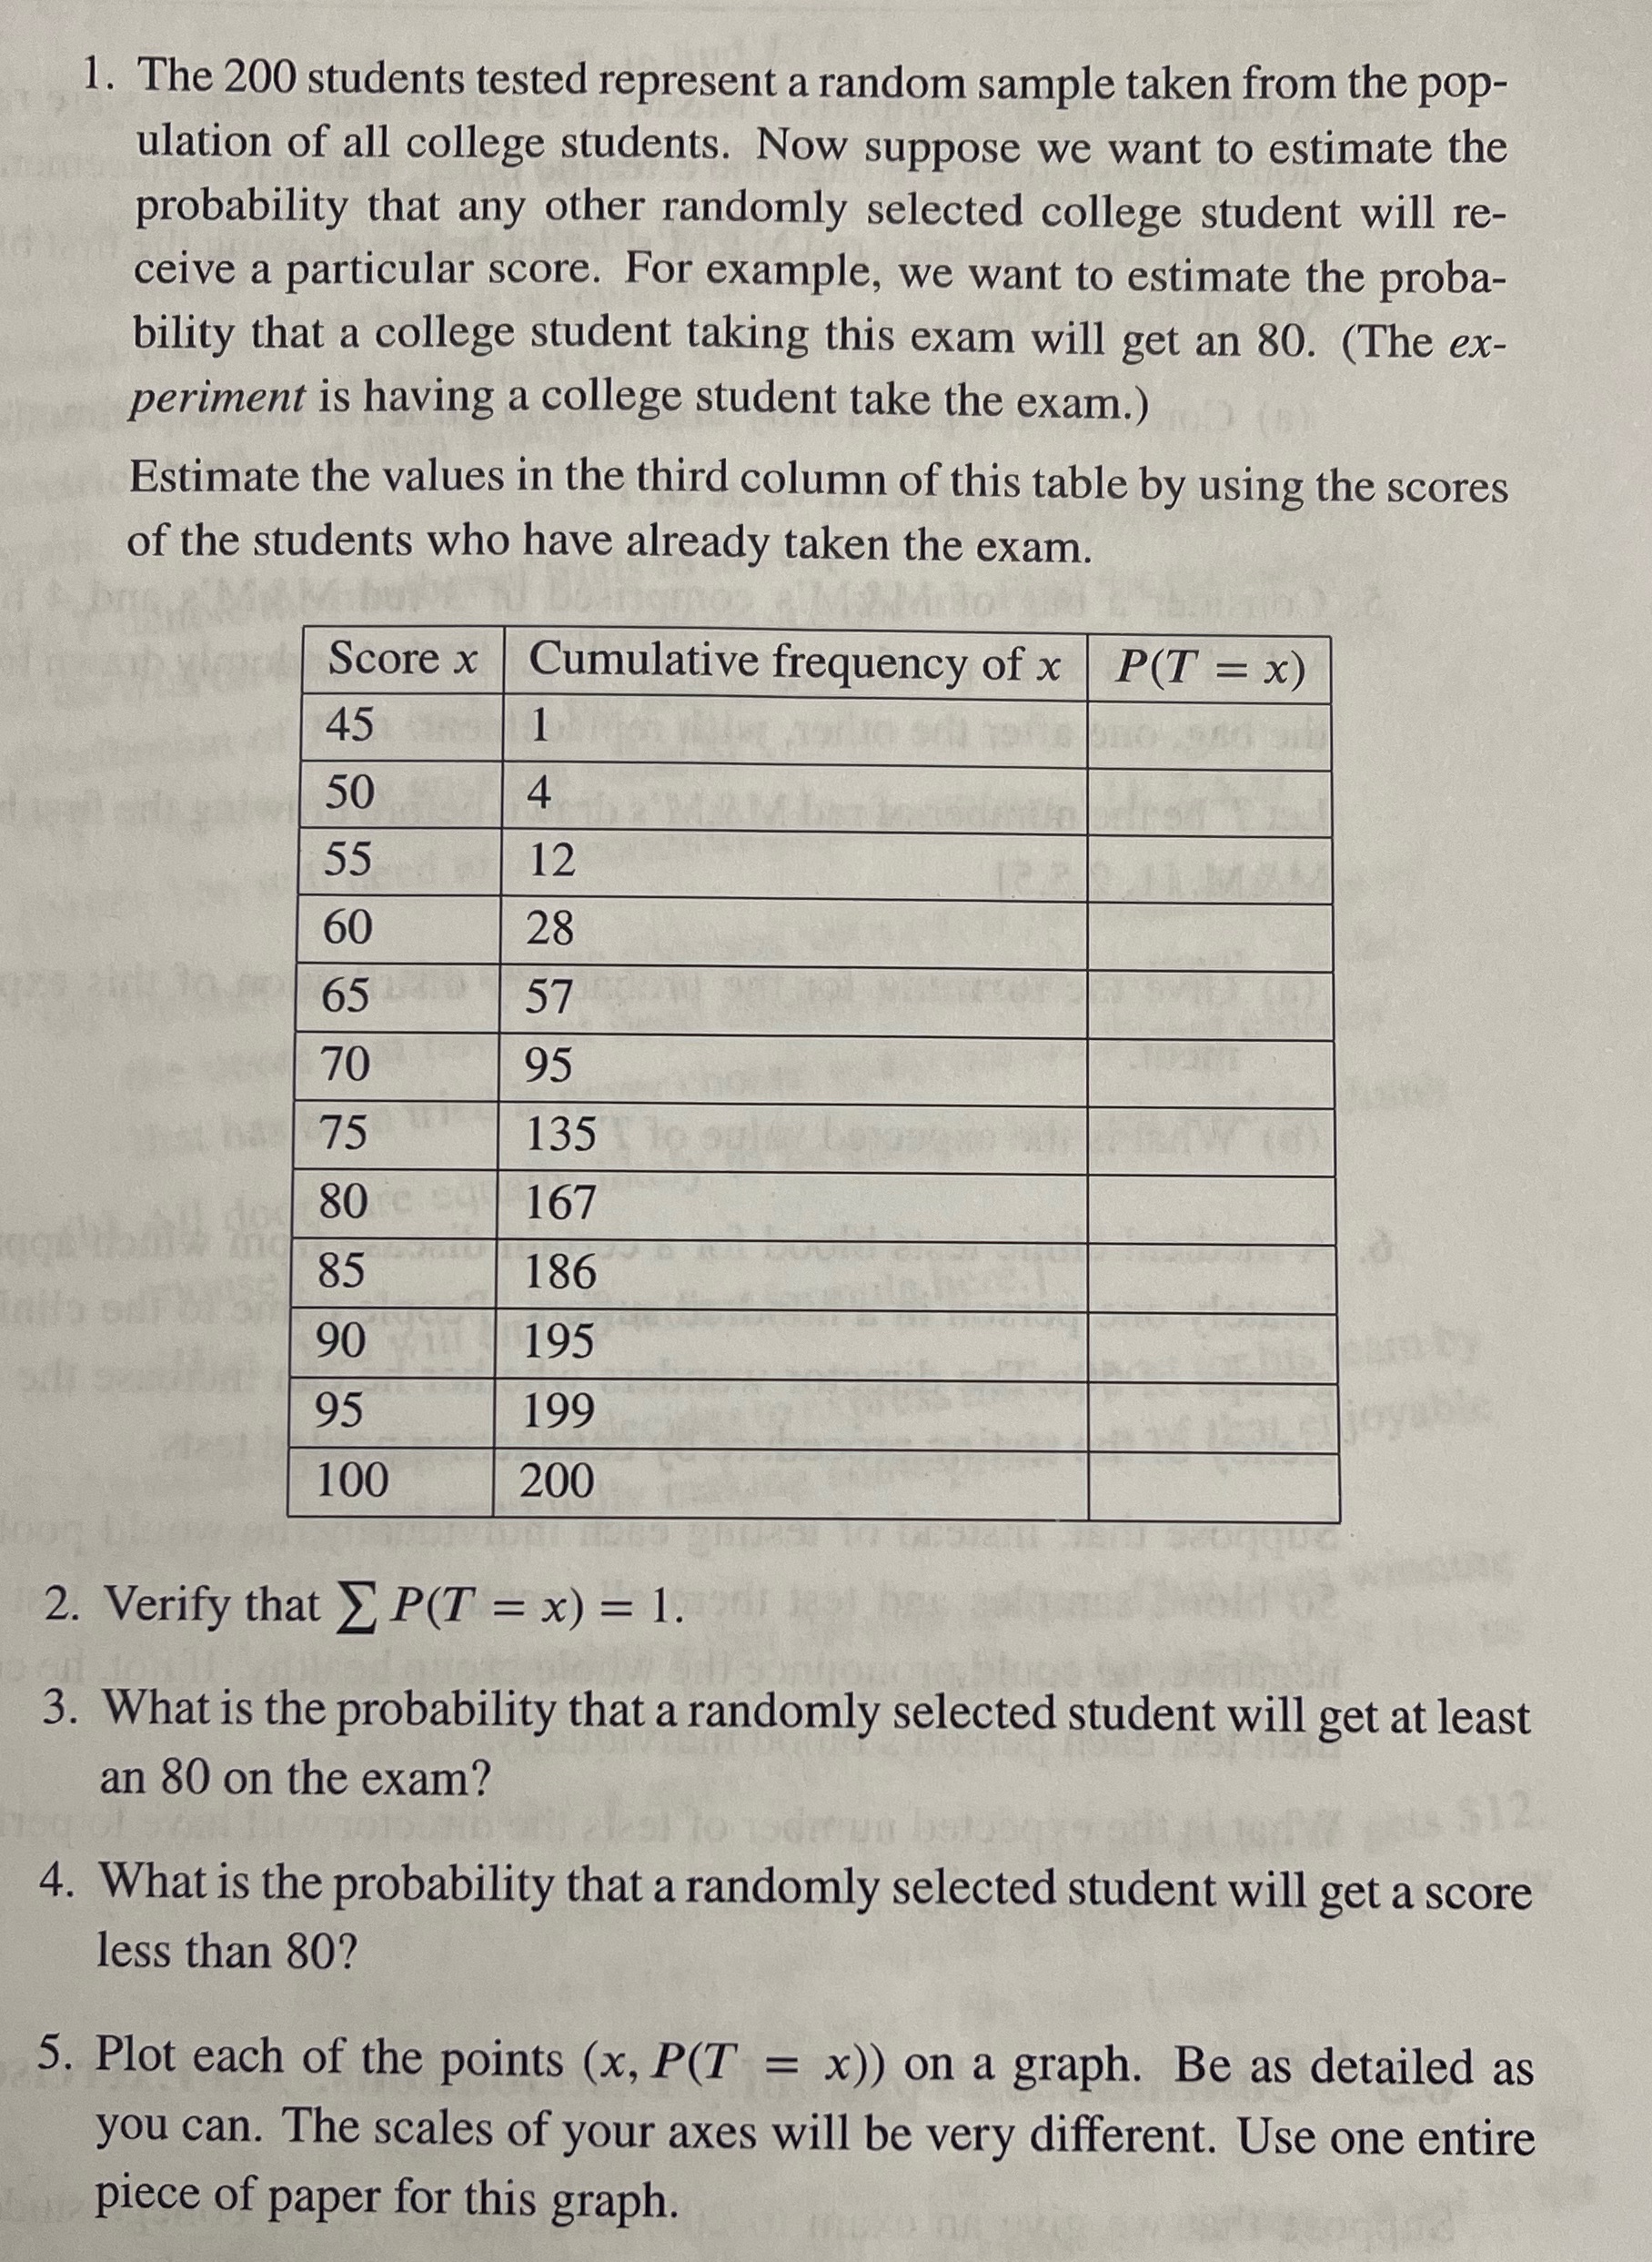
1. The 200 students tested represent a random sample taken from the pop- ulation of all college students. Now suppose we want to estimate the probability that any other randomly selected college student will re- ceive a particular score. For example, we want to estimate the proba- bility that a college student taking this exam will get an 80. (The ex- periment is having a college student take the exam.) Estimate the values in the third column of this table by using the scores of the students who have already taken the exam. Score x Cumulative frequency of x | P(T = x) 45 1 50 4 55 12 60 28 65 57 70 95 75 135 to out 80 167 85 186 90 195 95 199 Lovable 100 200 2. Verify that _ P(T = x) = 1. 3. What is the probability that a randomly selected student will get at least an 80 on the exam? 4. What is the probability that a randomly selected student will get a score less than 80? 5. Plot each of the points (x, P(T = x)) on a graph. Be as detailed as you can. The scales of your axes will be very different. Use one entire piece of paper for this graph
Step by Step Solution
There are 3 Steps involved in it

Get step-by-step solutions from verified subject matter experts