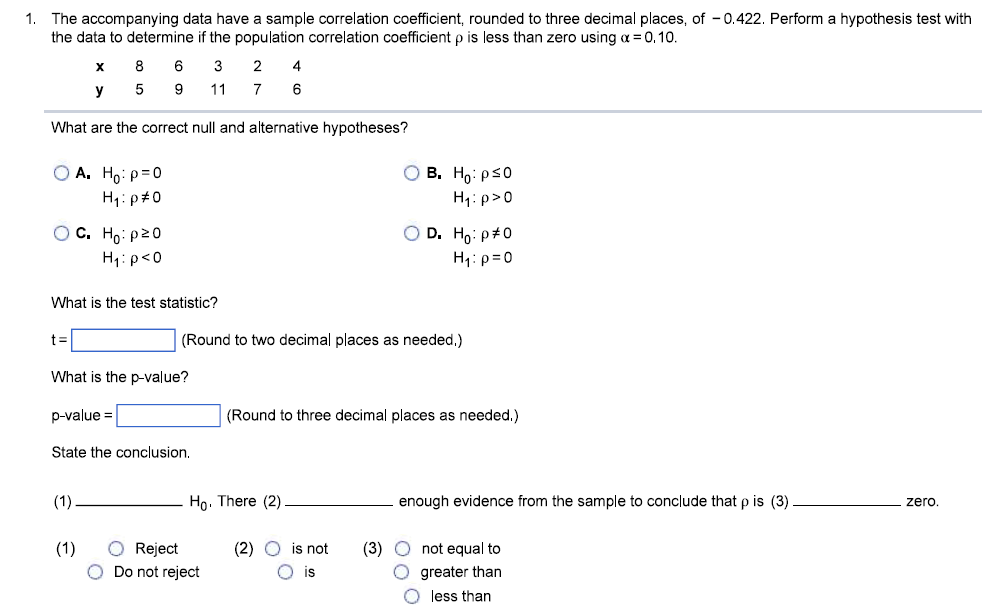
Question: 1. The accompanying data have a sample correlation coefficient, rounded to three decimal places, of - 0.422. Perform a hypothesis test with the data to

1. The accompanying data have a sample1. The accompanying data have a sample1. The accompanying data have a sample1. The accompanying data have a sample1. The accompanying data have a sample1. The accompanying data have a sample
1. The accompanying data have a sample correlation coefficient, rounded to three decimal places, of - 0.422. Perform a hypothesis test with the data to determine if the population correlation coefficient p is less than zero using a = 0, 10. X CO 6 3 A 5 9 11 6 What are the correct null and alternative hypotheses? OA. Ho: p= 0 OB. Ho: pso H1: p#0 H 1: p>0 OC. Ho: p20 OD. Ho: p#0 H1: p 0 Hy: p- 20 H,: p =0 O C. Ho: p2 20 O D. Ho: p2 so Hy: p- 0 Determine the critical F-score, Fox. For = (Round to three decimal places as needed.) Calculate the F-score for this test. F = (Round to three decimal places as needed.) Determine the correct conclusion. Choose the correct answer below. O A. Reject Ho. There does not appear to be a relationship between x and y, O B. Reject Ho. There appears to be a relationship between x and y, O C. Do not reject Ho. There does not appear to be a relationship between x and y. O D. Do not reject Ho. There appears to be a relationship between x and y.3. Consider the following set of ordered pairs. X 4 2 2 2 8 6 y 3 8 5 5 2 5 a) Calculate the correlation coefficient. b) Using of = 0.05, perform a hypothesis test to determine if the population correlation coefficient is less than zero. Click the icon to view a portion of the Student's t-distribution table. ajr= (Round to three decimal places as needed,) b) Determine the null and alternative hypotheses. Ho: p(1) Hy : p (2) The t-test statistic is (Round to three decimal places as needed.) The critical t-score(s) is(are) (Round to three decimal places as needed. Use a comma to separate answers as needed.) Because the test statistic is (3) the critical value, (4). the (5) One (6) conclude that the population correlation coefficient is (7) zero.3: Student's t-distribution 1 Tail 0.200 0.100 0:050 0.025 0.010 0.005 2 Tail 0.400 0.200 0.100 0.050 0.020 0,010 Conf Lev 0.600 0,800 0.900 0.950 0.980 0,990 1.376 3.078 6.314 12.706 31.821 63,657 1.061 1.886 2.920 4.303 6.965 9.925 0.978 1.638 2.353 3.182 4.541 5.841 0.941 1:533 2.132 2.776 3.747 4.604 0.920 1.476 2.015 2.571 3.365 4,032 0.906 1.440 1.943 2.447 3.143 3.707 0.896 1.415 1.895 2.365 2.998 3,499 0.889 1.397 1.860 2.306 2.896 3.355 0.883 1.383 1.833 2.262 2.821 3,250 0.879 1.372 1.812 2.228 2.764 3.169 0.876 1.363 1.796 2.201 2.718 3,106 0.873 1.356 1.782 2.179 2.681 3.055 0.870 1.350 1.771 2.160 2.650 3.012 0.856 1.341 1.753 2.131 2.602 2.947 16 0.865 1.337 1.746 2.120 2.583 2.921 17 0.863 1.333 1.740 2.110 2.567 2.898 18 0,862 1.330 1.734 2.101 2.552 2.878 19 0.861 1.328 1.729 2.093 2.539 2.861 20 0,860 1.325 1.725 2.086 2.528 2.845 21 0.859 1.323 1.721 2.080 2.518 2.831 22 0.858 1.321 1.717 2.074 2.508 2.819 23 0.858 1.319 1.714 2.069 2.500 2.807 24 0.857 1.318 1.71 1 2.064 2.492 2.797 25 0.856 1,316 1.708 2.060 2485 2.787 26 0.856 1.315 1.706 2.056 2.479 2.779(1) O (2) O O (3) O equal to (4) O do not reject (5) O null hypothesis. O 2 O O E O H MV II O greater than O reject O alternative hypothesis. S O less than O (6) can (7) O not equal to O cannot O less than O greater than O equal to4, As a measure of productivity, a cell phone company records the number of customers each of its retail employees activates weekly, An activation is defined as either a new customer signing a cell phone contract or an existing customer renewing a contract, The accompanying table shows the number of weekly activations for eight randomly selected employees along with their job-satisfaction levels rated on a scale of 1-10 (10 = Most satisfied), Complete parts a through G " Click the icon to view the table showing activations and satisfaction. a. Calculate the correlation coefficient for this sample. The correlation coefficient is (Type an integer or decimal rounded to three decimal places as needed. ) b. Using a = 0.10, test to determine if the population correlation coefficient is not equal to zero. The hypotheses for this test are (1) The test statistic is (Type an integer or decimal rounded to two decimal places as needed.) The p-value is "Type an integer or decimal rounded to three decimal places as needed.) Therefore, at the 0.10 level of significance, (2) the null hypothesis. There (3) sufficient evidence to conclude that the population correlation coefficient is (4) zero, c, What conclusions can be made based on these results? The conclusion is that there (5) - linear relationship between satisfaction and activations. 4: Table of activations and satisfaction Activations Satisfaction 37 24 7,9 38 8.5 35 9,0 17 6,1 28 7.0 33 8.2 23 7,7 (1) O Ho: p20 and Hy: p0 and H,: pso. O Ho: pso and H,: p>0. O reject O is not less than O Ho: p #0 and Hy: p= 0. greater than O Ho: p = 0 and Hy: pxo. (5) O is a positive O is a is not a is a negative

Step by Step Solution

There are 3 Steps involved in it

1 Expert Approved Answer
Step: 1 Unlock blur-text-image
Question Has Been Solved by an Expert!

Get step-by-step solutions from verified subject matter experts

Step: 2 Unlock
Step: 3 Unlock

Students Have Also Explored These Related Mathematics Questions!