

Question: 1. The average annual exchange rate between two countries is shown in the table below. Year Exchange Rate 2008 0.94 2009 0.92 2010 0.97
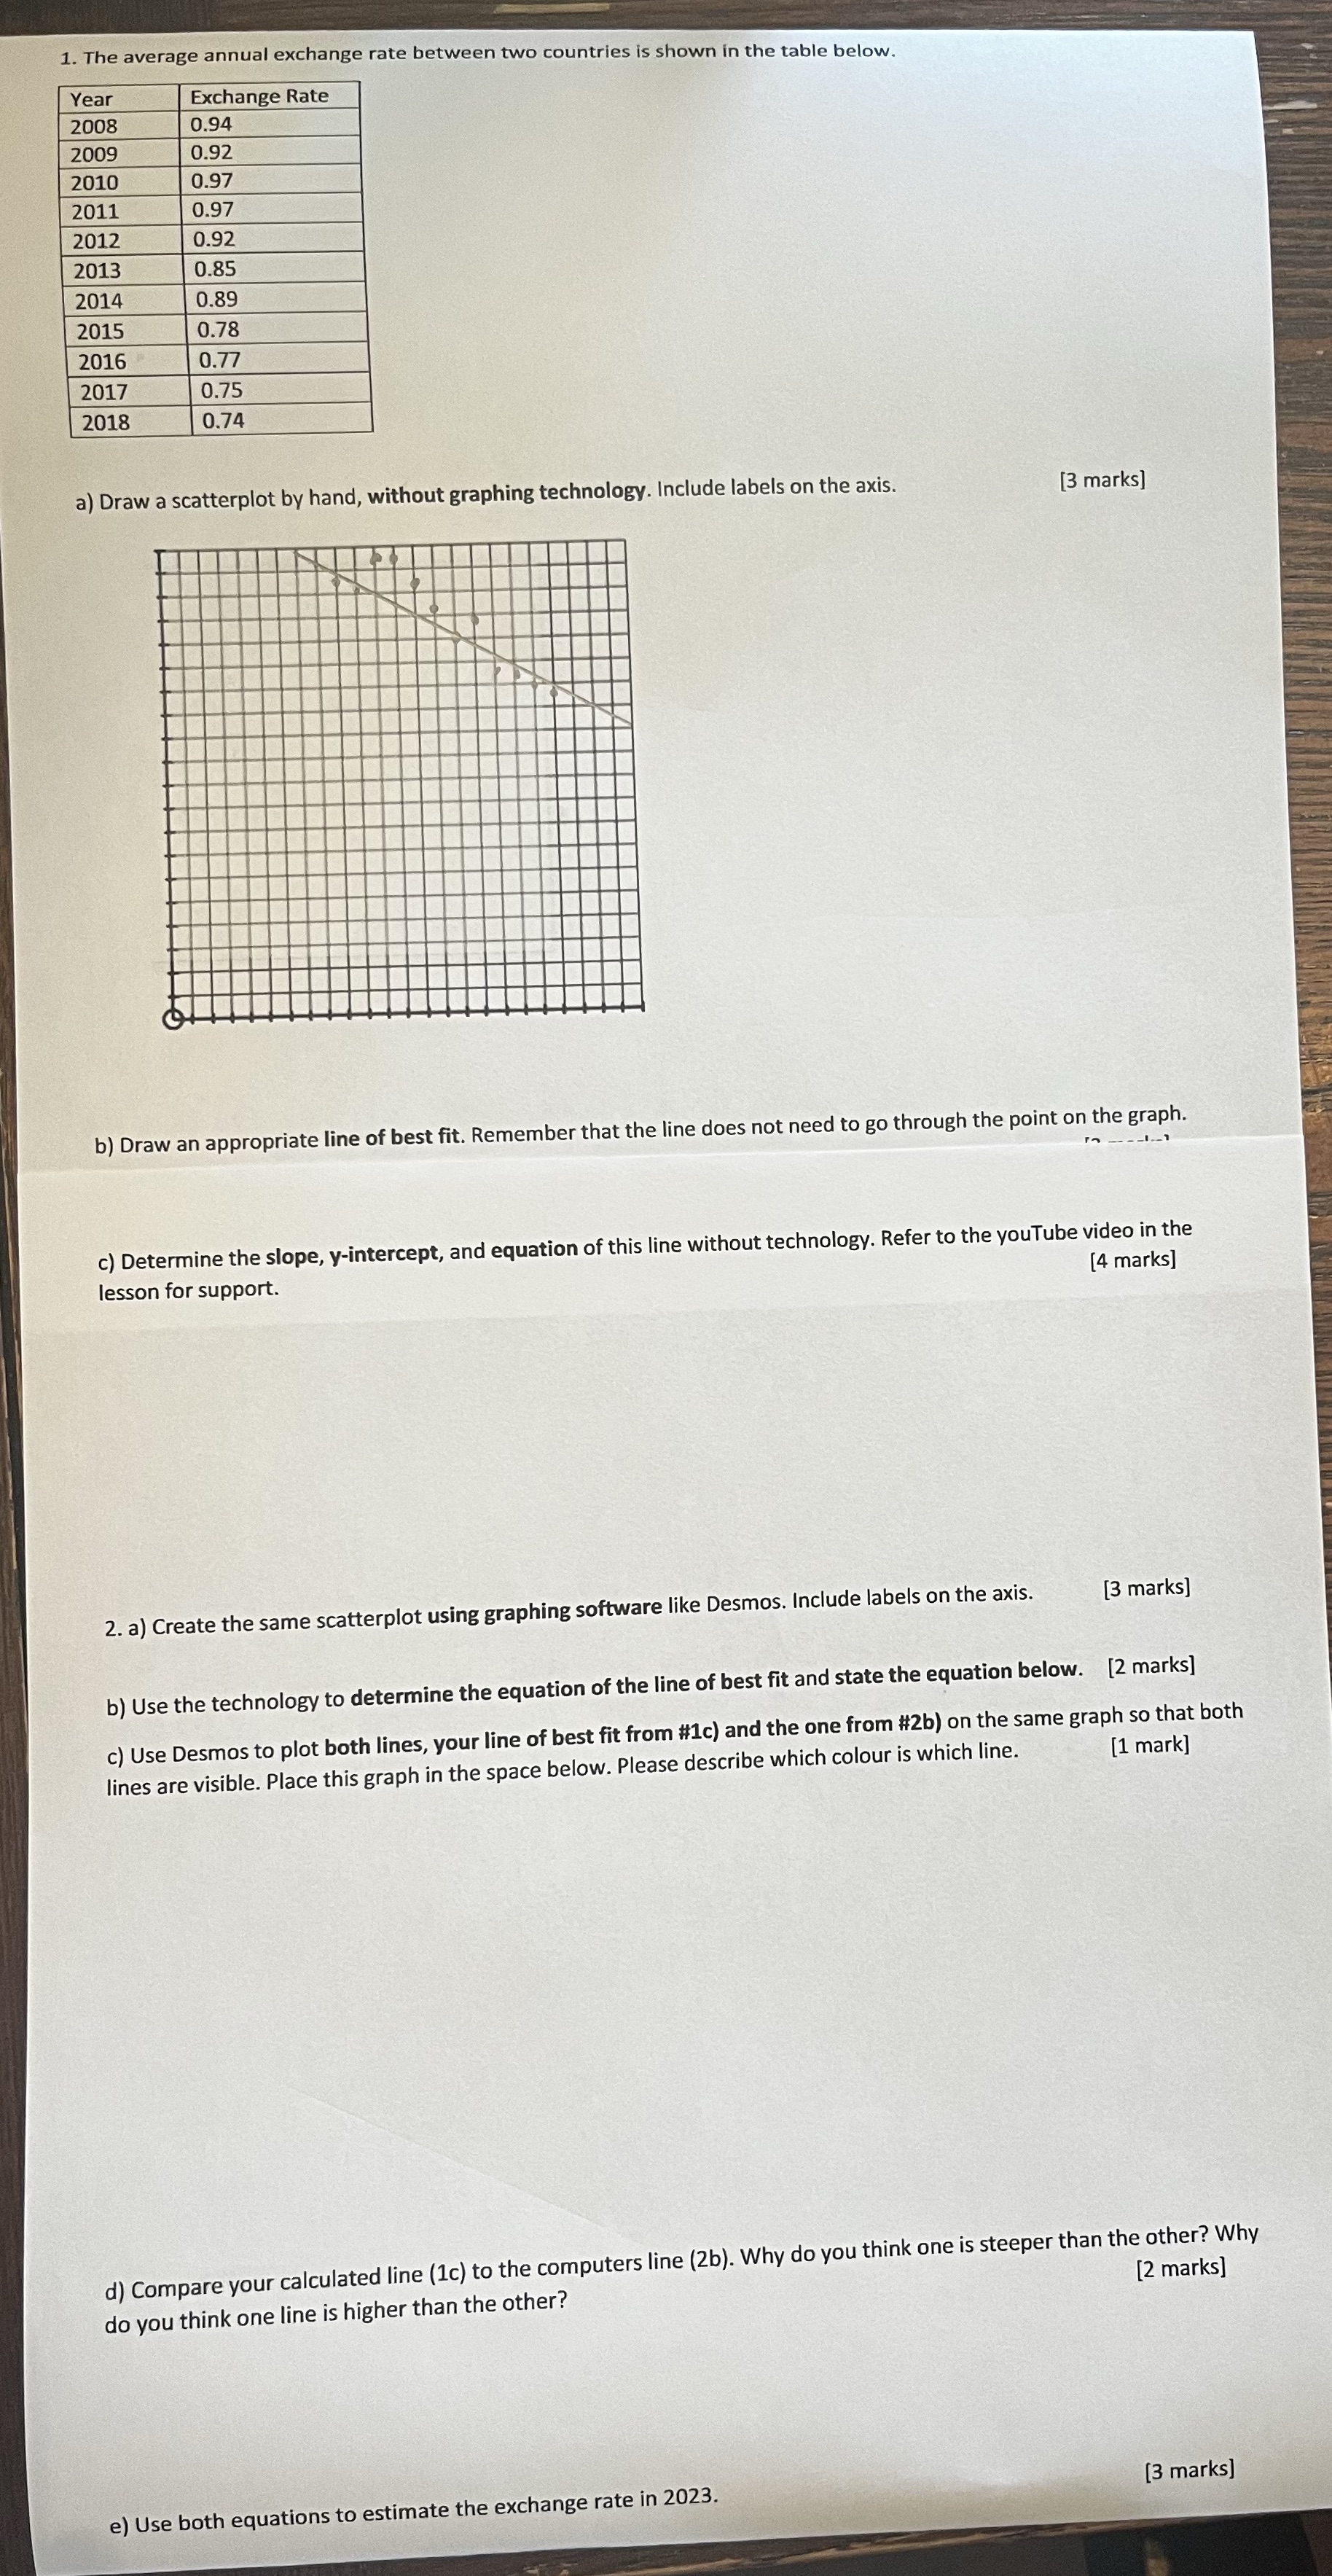
1. The average annual exchange rate between two countries is shown in the table below. Year Exchange Rate 2008 0.94 2009 0.92 2010 0.97 2011 0.97 2012 0.92 2013 0.85 2014 0.89 2015 0.78 2016 0.77 2017 0.75 2018 0.74 a) Draw a scatterplot by hand, without graphing technology. Include labels on the axis. [3 marks] b) Draw an appropriate line of best fit. Remember that the line does not need to go through the point on the graph. c) Determine the slope, y-intercept, and equation of this line without technology. Refer to the youTube video in the lesson for support. [4 marks] 2. a) Create the same scatterplot using graphing software like Desmos. Include labels on the axis. [3 marks] b) Use the technology to determine the equation of the line of best fit and state the equation below. [2 marks] [1 mark] c) Use Desmos to plot both lines, your line of best fit from #1c) and the one from #2b) on the same graph so that both lines are visible. Place this graph in the space below. Please describe which colour is which line. d) Compare your calculated line (1c) to the computers line (2b). Why do you think one is steeper than the other? Why do you think one line is higher than the other? [2 marks] e) Use both equations to estimate the exchange rate in 2023. [3 marks]
Step by Step Solution
There are 3 Steps involved in it

Get step-by-step solutions from verified subject matter experts