

Question: 1. The box plot below shows the data distribution of ages of hockey players on a professional hockey team. Study the box plot. Which of
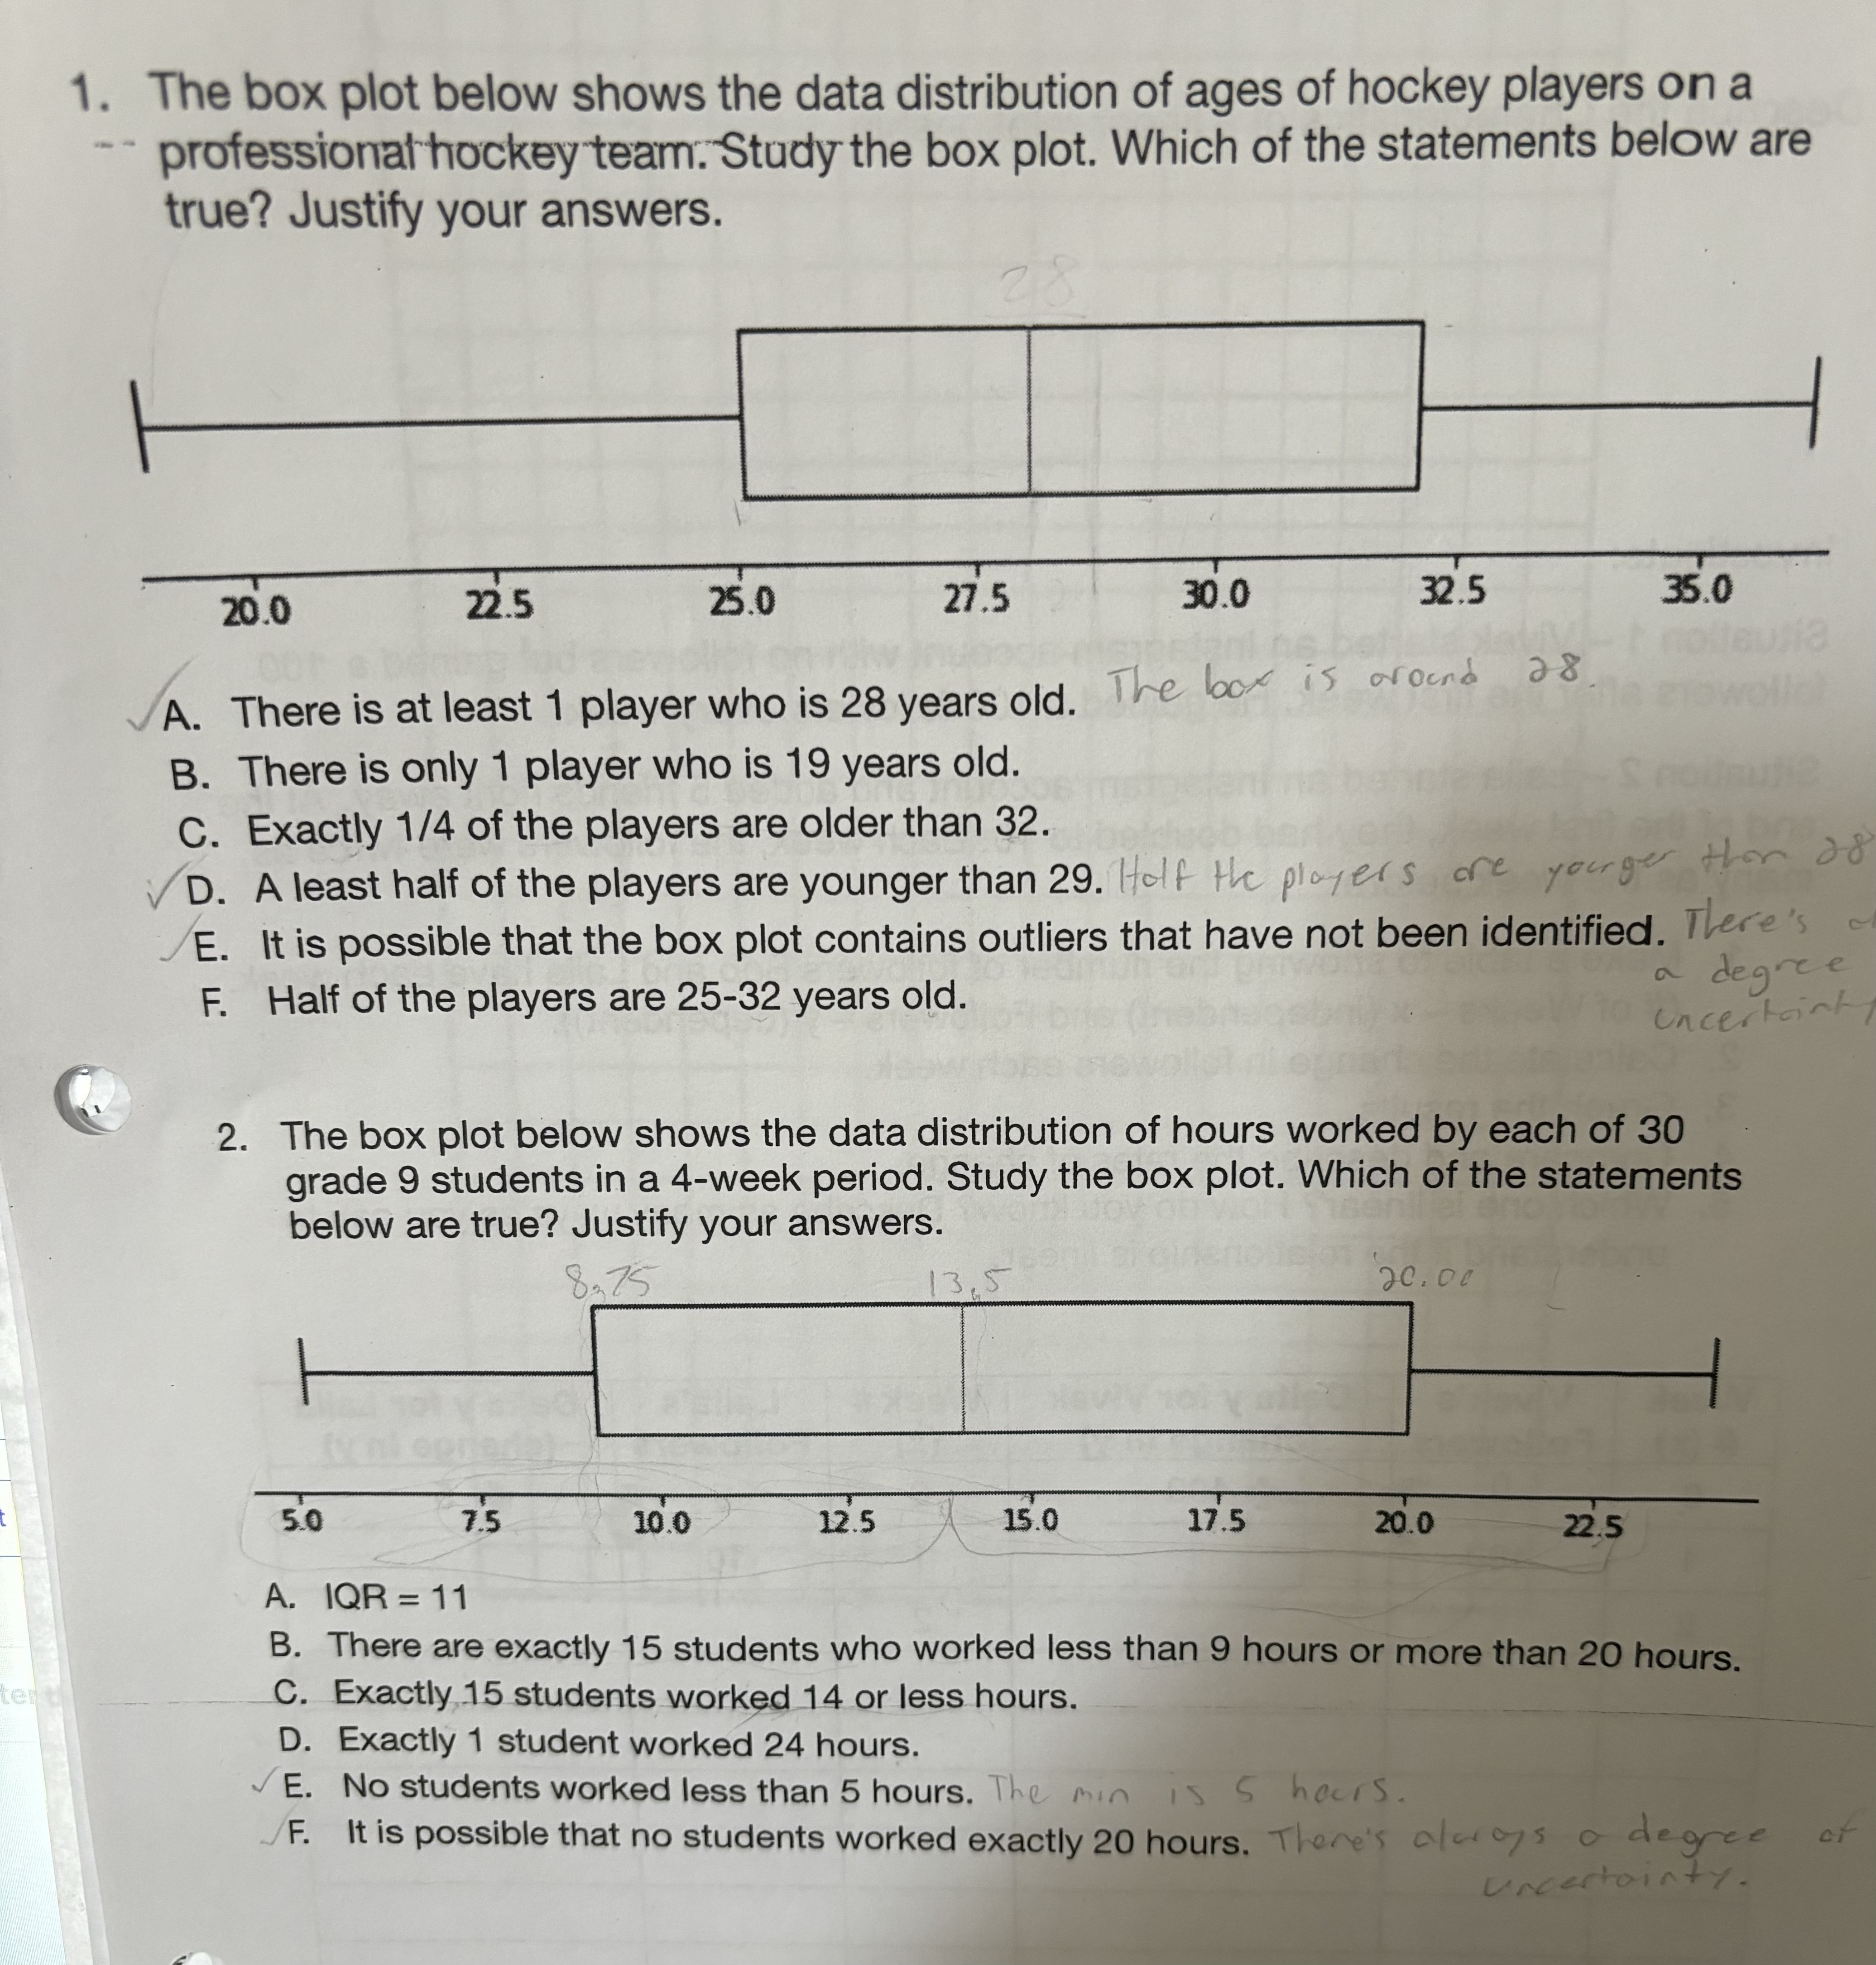
1. The box plot below shows the data distribution of ages of hockey players on a professional hockey team. Study the box plot. Which of the statements below are true? Justify your answers. 20.0 22.5 25.0 27.5 30.0 32.5 35.0 A. There is at least 1 player who is 28 years old. The box is around 28 Towoll B. There is only 1 player who is 19 years old. C. Exactly 1/4 of the players are older than 32. /D. A least half of the players are younger than 29. Half the players are younger than a8 /E. It is possible that the box plot contains outliers that have not been identified. There's F. Half of the players are 25-32 years old. a degree uncertaint 2. The box plot below shows the data distribution of hours worked by each of 30 grade 9 students in a 4-week period. Study the box plot. Which of the statements below are true? Justify your answers. 8 375 13 , 5 20.00 5.0 7.5 10.0 12.5 15.0 17.5 20.0 22.5 A. IQR = 11 B. There are exactly 15 students who worked less than 9 hours or more than 20 hours. C. Exactly 15 students worked 14 or less hours. D. Exactly 1 student worked 24 hours. E. No students worked less than 5 hours. The min is 5 hours. /F. It is possible that no students worked exactly 20 hours. There's always a degree uncertainty
Step by Step Solution
There are 3 Steps involved in it

Get step-by-step solutions from verified subject matter experts