

Question: 1. The company decided to use a quantitative method for forecasting demand. Do you agree with that decision? Why? Your answer should include a comparison
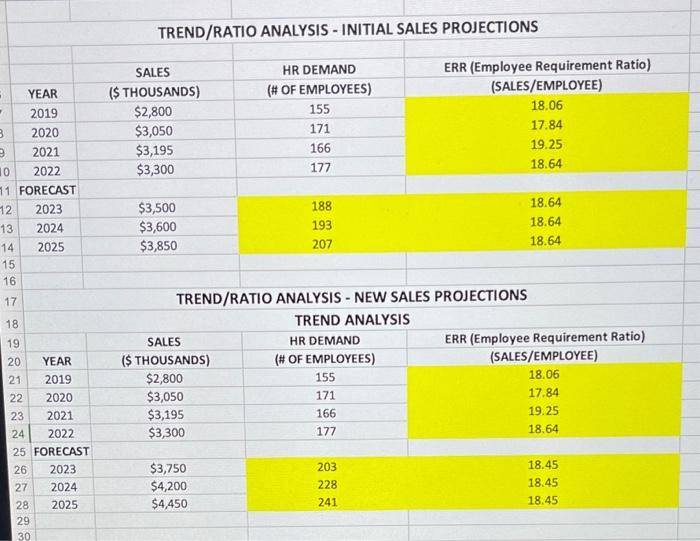
1. The company decided to use a quantitative method for forecasting demand. Do you agree with that decision? Why? Your answer should include a comparison between quantitative and qualitative methods.
2. What conclusions can you draw from the demand analysis?
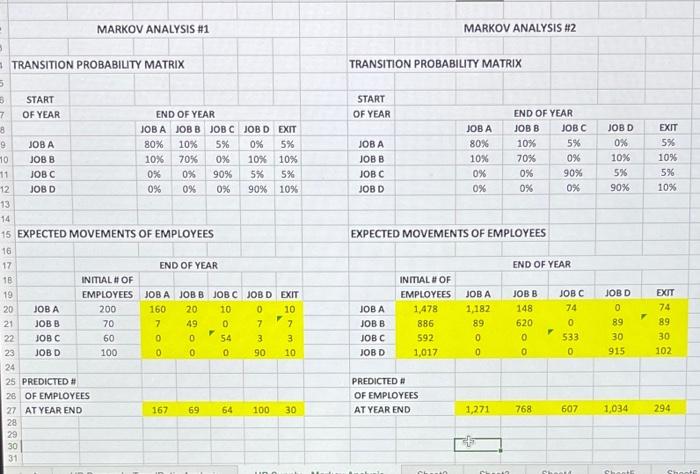
3. What is the Markov Analysis telling you in terms of supply? Are there any areas of concern? What are the external hiring needs?
TREND/RATIO ANALYSIS - INITIAL SALES PROJECTIONS MARIKOV ANALYSIS \#1 MARKOV ANALYSIS \#2 TRANSITION PROBABIUTY MATRIX TRANSITION PROBABILITY MATRIX \begin{tabular}{|l|c|c|c|c|} \hline & START & & \\ \hline 7 & OF YEAR & \multicolumn{2}{|c|}{ END OF YEAR } \\ \hline 8 & & 10BA & JOB B & Jo \\ \hline 9 & JOB A & 80% & 10% & 5 \\ 10 & JOB B & 10% & 70% & 0 \\ \hline 11 & 10BC & 0% & 0% & 9 \\ \hline 12 & JOB D & 0% & 0% & 0 \\ \hline 13 & & & & \\ \hline 14 & & & \\ \hline 15 & EXPECTED MOVEMENTS OF EMPLOYEES \\ \hline \end{tabular} \begin{tabular}{|c|c|c|c|c|c|} \hline START & \multicolumn{5}{|c|}{ END OF YEAR } \\ \hline OF YEAR & JOB A & JOB B & JOBC & JOB D & EXIT \\ \hline & 80% & 10% & 5% & 0% & 5% \\ \hline JOB A & 10% & 70% & 0% & 10% & 10% \\ \hline JOB B & 0% & 0% & 90% & 5% & 5% \\ \hline JOB C & 0% & 0% & 0% & 90% & 10% \\ \hline JOB D & & & & & \\ \hline \end{tabular} EXPECTED MOVEMENTS OF EMPLOYEES
Step by Step Solution
There are 3 Steps involved in it

Get step-by-step solutions from verified subject matter experts