

Question: 1. The data below was collected to see if the political leaning of a state's population was related to the obesity rate of adults in
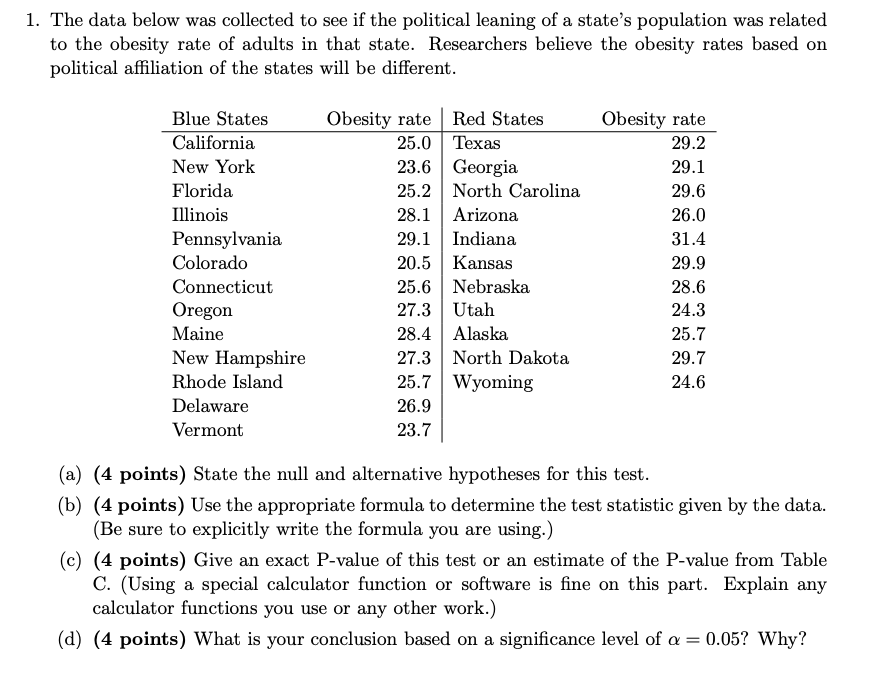

1. The data below was collected to see if the political leaning of a state's population was related to the obesity rate of adults in that state. Researchers believe the obesity rates based on political affiliation of the states will be different. Blue States Obesity rate Red States Obesity rate California 25.0 Texas 29.2 New York 23.6 Georgia 29.1 Florida 25.2 North Carolina 29.6 Illinois 28.1 Arizona 26.0 Pennsylvania 29.1 Indiana 31.4 Colorado 20.5 Kansas 29.9 Connecticut 25.6 Nebraska 28.6 Oregon 27.3 Utah 24.3 Maine 28.4 Alaska 25.7 New Hampshire 27.3 North Dakota 29.7 Rhode Island 25.7 Wyoming 24.6 Delaware 26.9 Vermont 23.7 (a) (4 points) State the null and alternative hypotheses for this test. (b) (4 points) Use the appropriate formula to determine the test statistic given by the data. (Be sure to explicitly write the formula you are using.) (c) (4 points) Give an exact P-value of this test or an estimate of the P-value from Table C. (Using a special calculator function or software is fine on this part. Explain any calculator functions you use or any other work.) (d) (4 points) What is your conclusion based on a significance level of a = 0.05? Why
Step by Step Solution
There are 3 Steps involved in it

Get step-by-step solutions from verified subject matter experts