

Question: 1. The data in Table 1 below is for the country of Maldova Combination Chocolates Cakes A 200 0 B 180 90 C 150 170
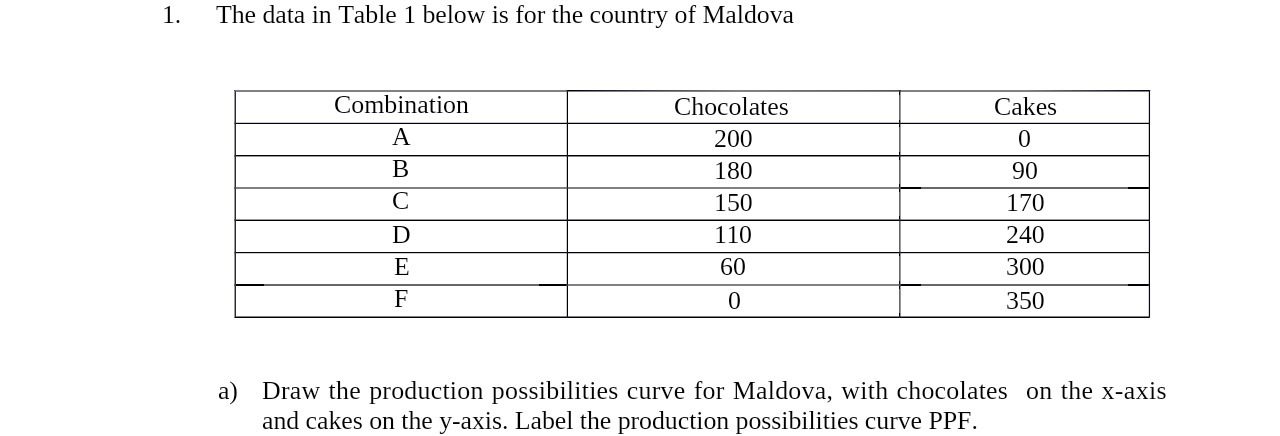

1. The data in Table 1 below is for the country of Maldova Combination Chocolates Cakes A 200 0 B 180 90 C 150 170 D 110 240 E 60 300 F 0 350 a) Draw the production possibilities curve for Maldova, with chocolates on the x-axis and cakes on the y-axis. Label the production possibilities curve PPF
Step by Step Solution
There are 3 Steps involved in it
1 Expert Approved Answer
Step: 1 Unlock

Question Has Been Solved by an Expert!
Get step-by-step solutions from verified subject matter experts
Step: 2 Unlock
Step: 3 Unlock