

Question: 1: The figure below represents part of the performance data of a car owned by a proud physics student. (The horizontal axis is marked in
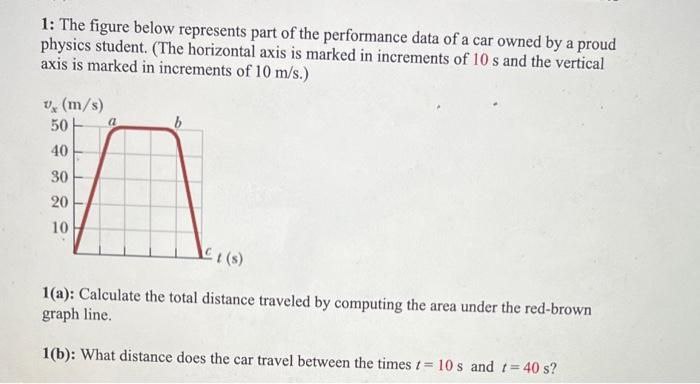
1: The figure below represents part of the performance data of a car owned by a proud physics student. (The horizontal axis is marked in increments of 10 s and the vertical axis is marked in increments of 10 m/s.) UN (m/s) 50 a b 15 1 (s) 1(a): Calculate the total distance traveled by computing the area under the red-brown graph line. 1(b): What distance does the car travel between the times / = 10 s and / = 40 s
Step by Step Solution
There are 3 Steps involved in it
1 Expert Approved Answer
Step: 1 Unlock

Question Has Been Solved by an Expert!
Get step-by-step solutions from verified subject matter experts
Step: 2 Unlock
Step: 3 Unlock