

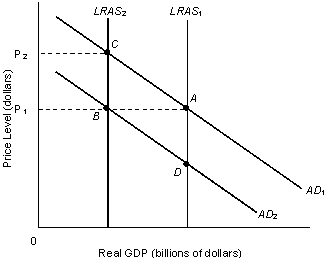
Question: 1. The figure given below represents the long-run equilibrium in the aggregate demand and aggregate supply model. Suppose that the economy is initially at equilibrium
1. The figure given below represents the long-run equilibrium in the aggregate demand and aggregate supply model. Suppose that the economy is initially at equilibrium point D in the accompanying figure. Figure 16
Step by Step Solution
There are 3 Steps involved in it
1 Expert Approved Answer
Step: 1 Unlock

Question Has Been Solved by an Expert!
Get step-by-step solutions from verified subject matter experts
Step: 2 Unlock
Step: 3 Unlock