

Question: 1: The following Activity on Node network is the representation of the following project description in the table. C A D Start Finish B Activity
1:
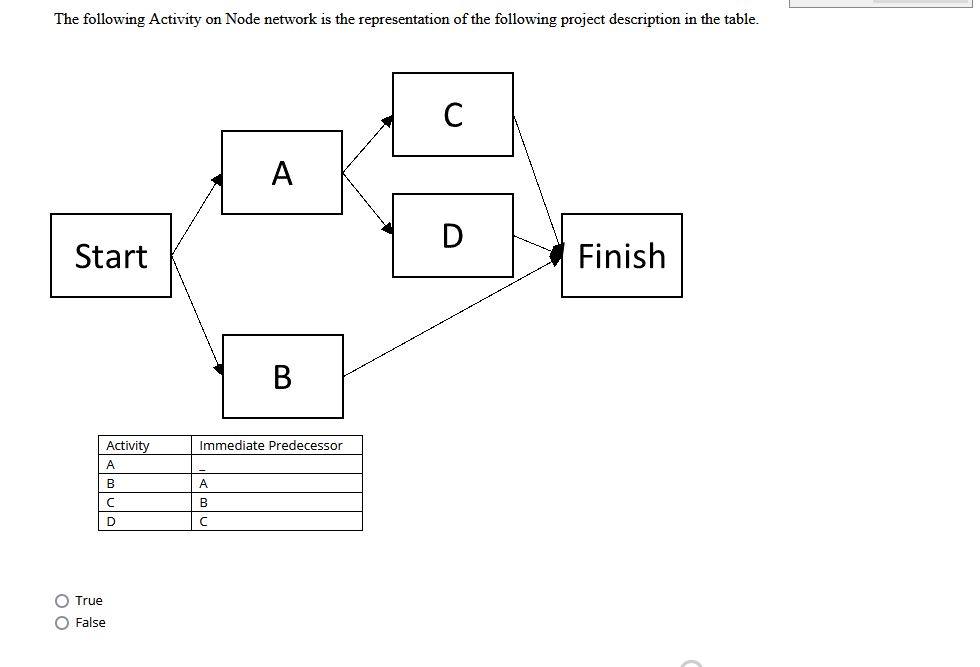
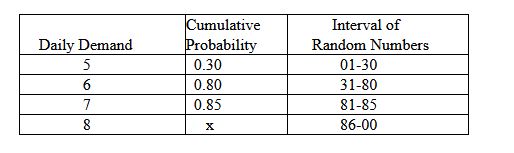
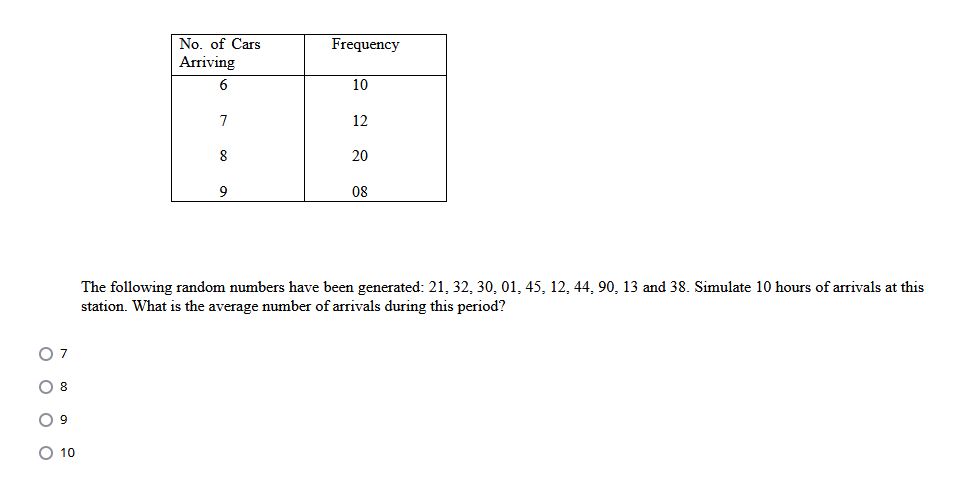
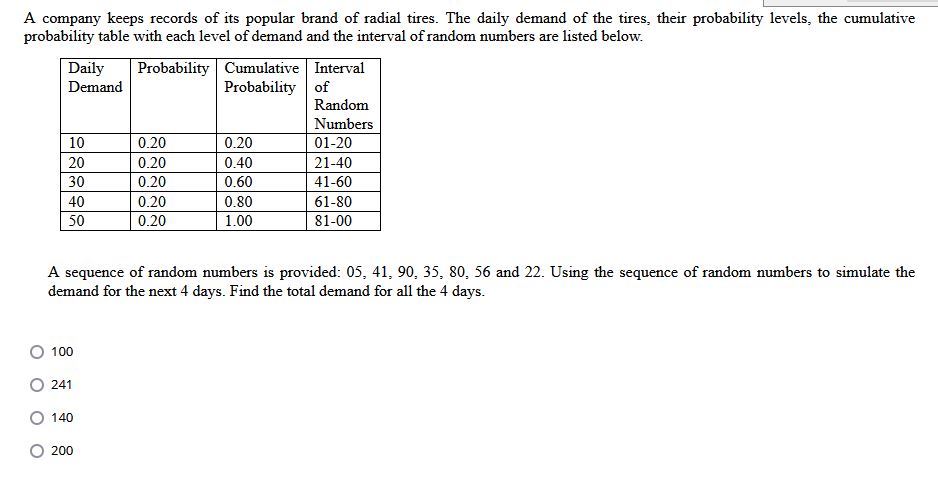
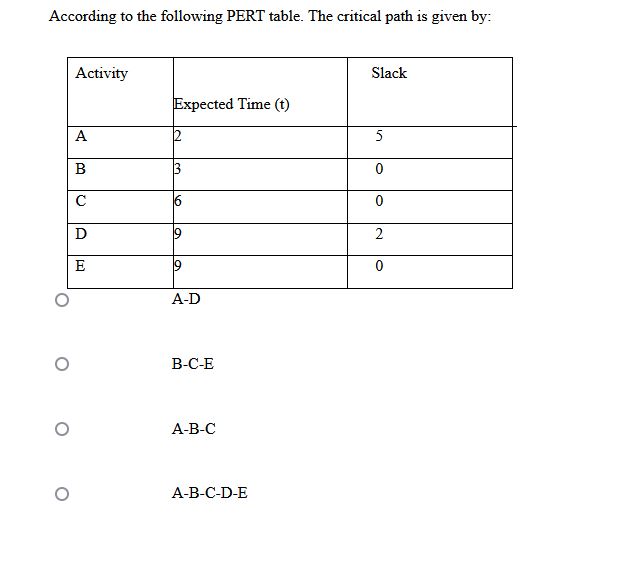
The following Activity on Node network is the representation of the following project description in the table. C A D Start Finish B Activity Immediate Predecessor A B A B D C True O FalseCumulative Interval of Daily Demand Probability Random Numbers 5 0.30 01-30 6 0.80 31-80 0.85 81-85 8 X 86-00No. of Cars Frequemzy Arriving 6 10 T 12 8 2D 9 DB The following random numbers have been generated: 21, 32, 3D, 01, 45, 12, 44, 90,13 and 38. Simulate 10 horns ofarrivals at this station. What is the average number of arrivals during this period? | A company keeps records of its popular brand of radial tires. The daily demand of the tires= their probability levels, the cumulative probability table with each level of demand and the interval of random numbers are listed below. Daily Probability Cumulative Demand Probability 10 0.20 0.20 20 0.20 0.40 30 0.20 0.60 40 0.20 0.80 50 0.20 1.00 A sequence of random numbers is provided: 05, 41, 90, 35, 8'0, 56 and 22. Using ue sequence of random numbers to simulate the demand forthenext4 days. Find1etotaldemandforathe4days. According to the following PERT table. The critical path is given by: Activity Slack \" ___ -__ __ -__ o AD O BaC-E O lei34o o ABCDE
Step by Step Solution
There are 3 Steps involved in it

Get step-by-step solutions from verified subject matter experts