

Question: 1 The following boxplot was created from a sample of 100 contract values. You would like to use this data to create an estimate of
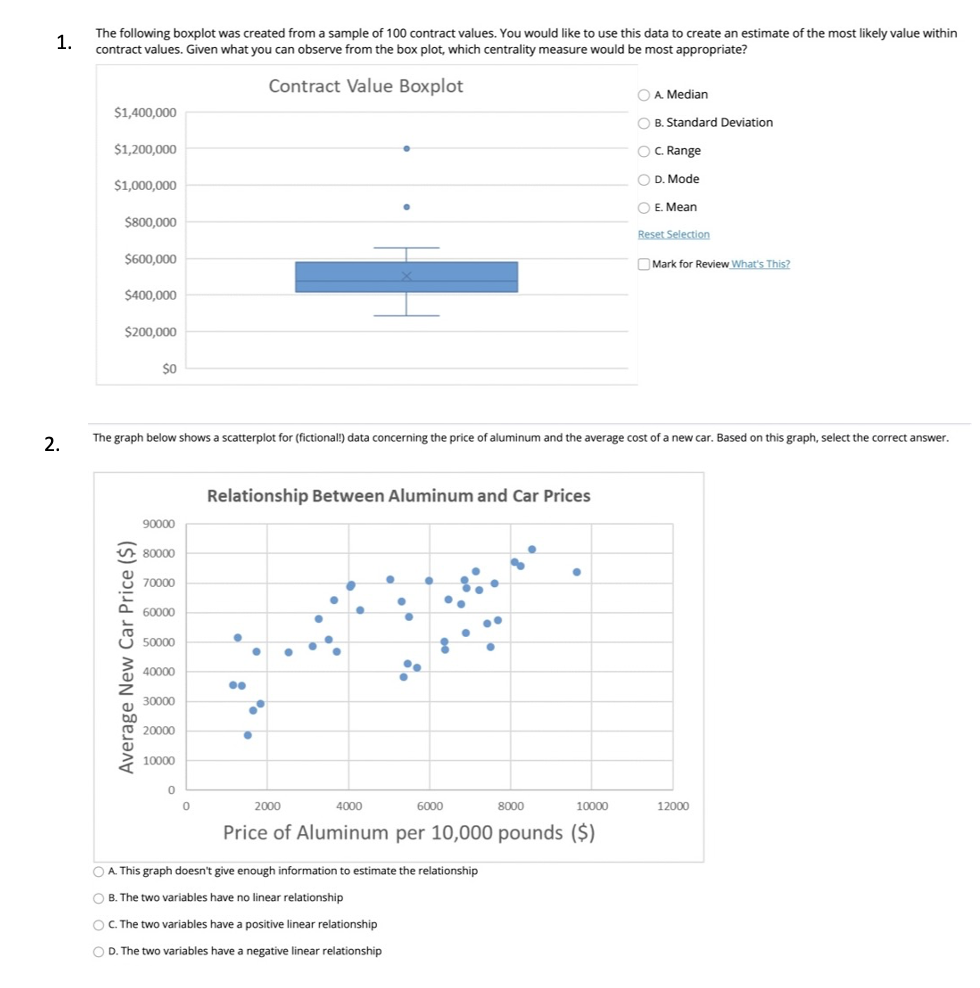
1 The following boxplot was created from a sample of 100 contract values. You would like to use this data to create an estimate of the most likely value within contract values. Given what you can observe from the box plot, which centrality measure would be most appropriate? Contract Value Boxplot O A Median $1,400,000 B. Standard Deviation $1,200,000 O C. Range $1,000,000 D. Mode O E. Mean $800,000 Reset Selection $600,000 Mark for Review What's This? $400,000 $200,000 SO 2. The graph below shows a scatterplot for (fictional!) data concerning the price of aluminum and the average cost of a new car. Based on this graph, select the correct answer. Relationship Between Aluminum and Car Prices 90000 Un 80000 70000 60000 50000 Average New Car Price 40000 30000 20000 10000 2000 4000 6000 8000 10000 12000 Price of Aluminum per 10,000 pounds ($) O A This graph doesn't give enough information to estimate the relationship O B. The two variables have no linear relationship O C. The two variables have a positive linear relationship O D. The two variables have a negative linear relationship
Step by Step Solution
There are 3 Steps involved in it

Get step-by-step solutions from verified subject matter experts