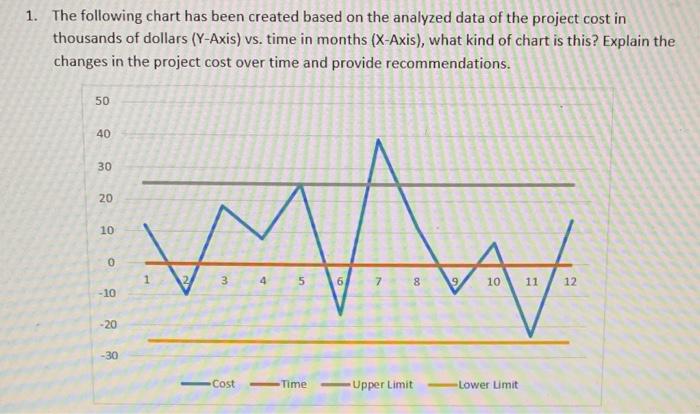
Question: 1. The following chart has been created based on the analyzed data of the project cost in thousands of dollars (Y-Axis) vs. time in months

1. The following chart has been created based on
1. The following chart has been created based on the analyzed data of the project cost in thousands of dollars (Y-Axis) vs. time in months (X-Axis), what kind of chart is this? Explain the changes in the project cost over time and provide recommendations

Step by Step Solution

There are 3 Steps involved in it

1 Expert Approved Answer
Step: 1 Unlock blur-text-image
Question Has Been Solved by an Expert!

Get step-by-step solutions from verified subject matter experts

Step: 2 Unlock
Step: 3 Unlock

Students Have Also Explored These Related General Management Questions!