

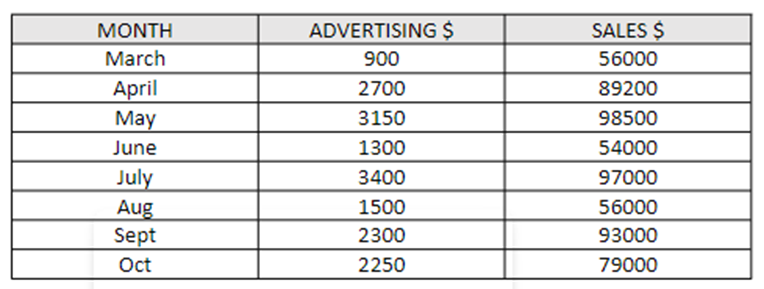
Question: 1. The following chart is data over an 8 month period that shows how much a company spent in advertising and the sales revenue for
1. The following chart is data over an 8 month period that shows how much a company spent in advertising and the sales revenue for that month
Step by Step Solution
There are 3 Steps involved in it
1 Expert Approved Answer
Step: 1 Unlock

Question Has Been Solved by an Expert!
Get step-by-step solutions from verified subject matter experts
Step: 2 Unlock
Step: 3 Unlock