

Question: 1. The following data represent the continuous random variable which is the precipitation totals for the month of September in 21 different towns in Alaska.
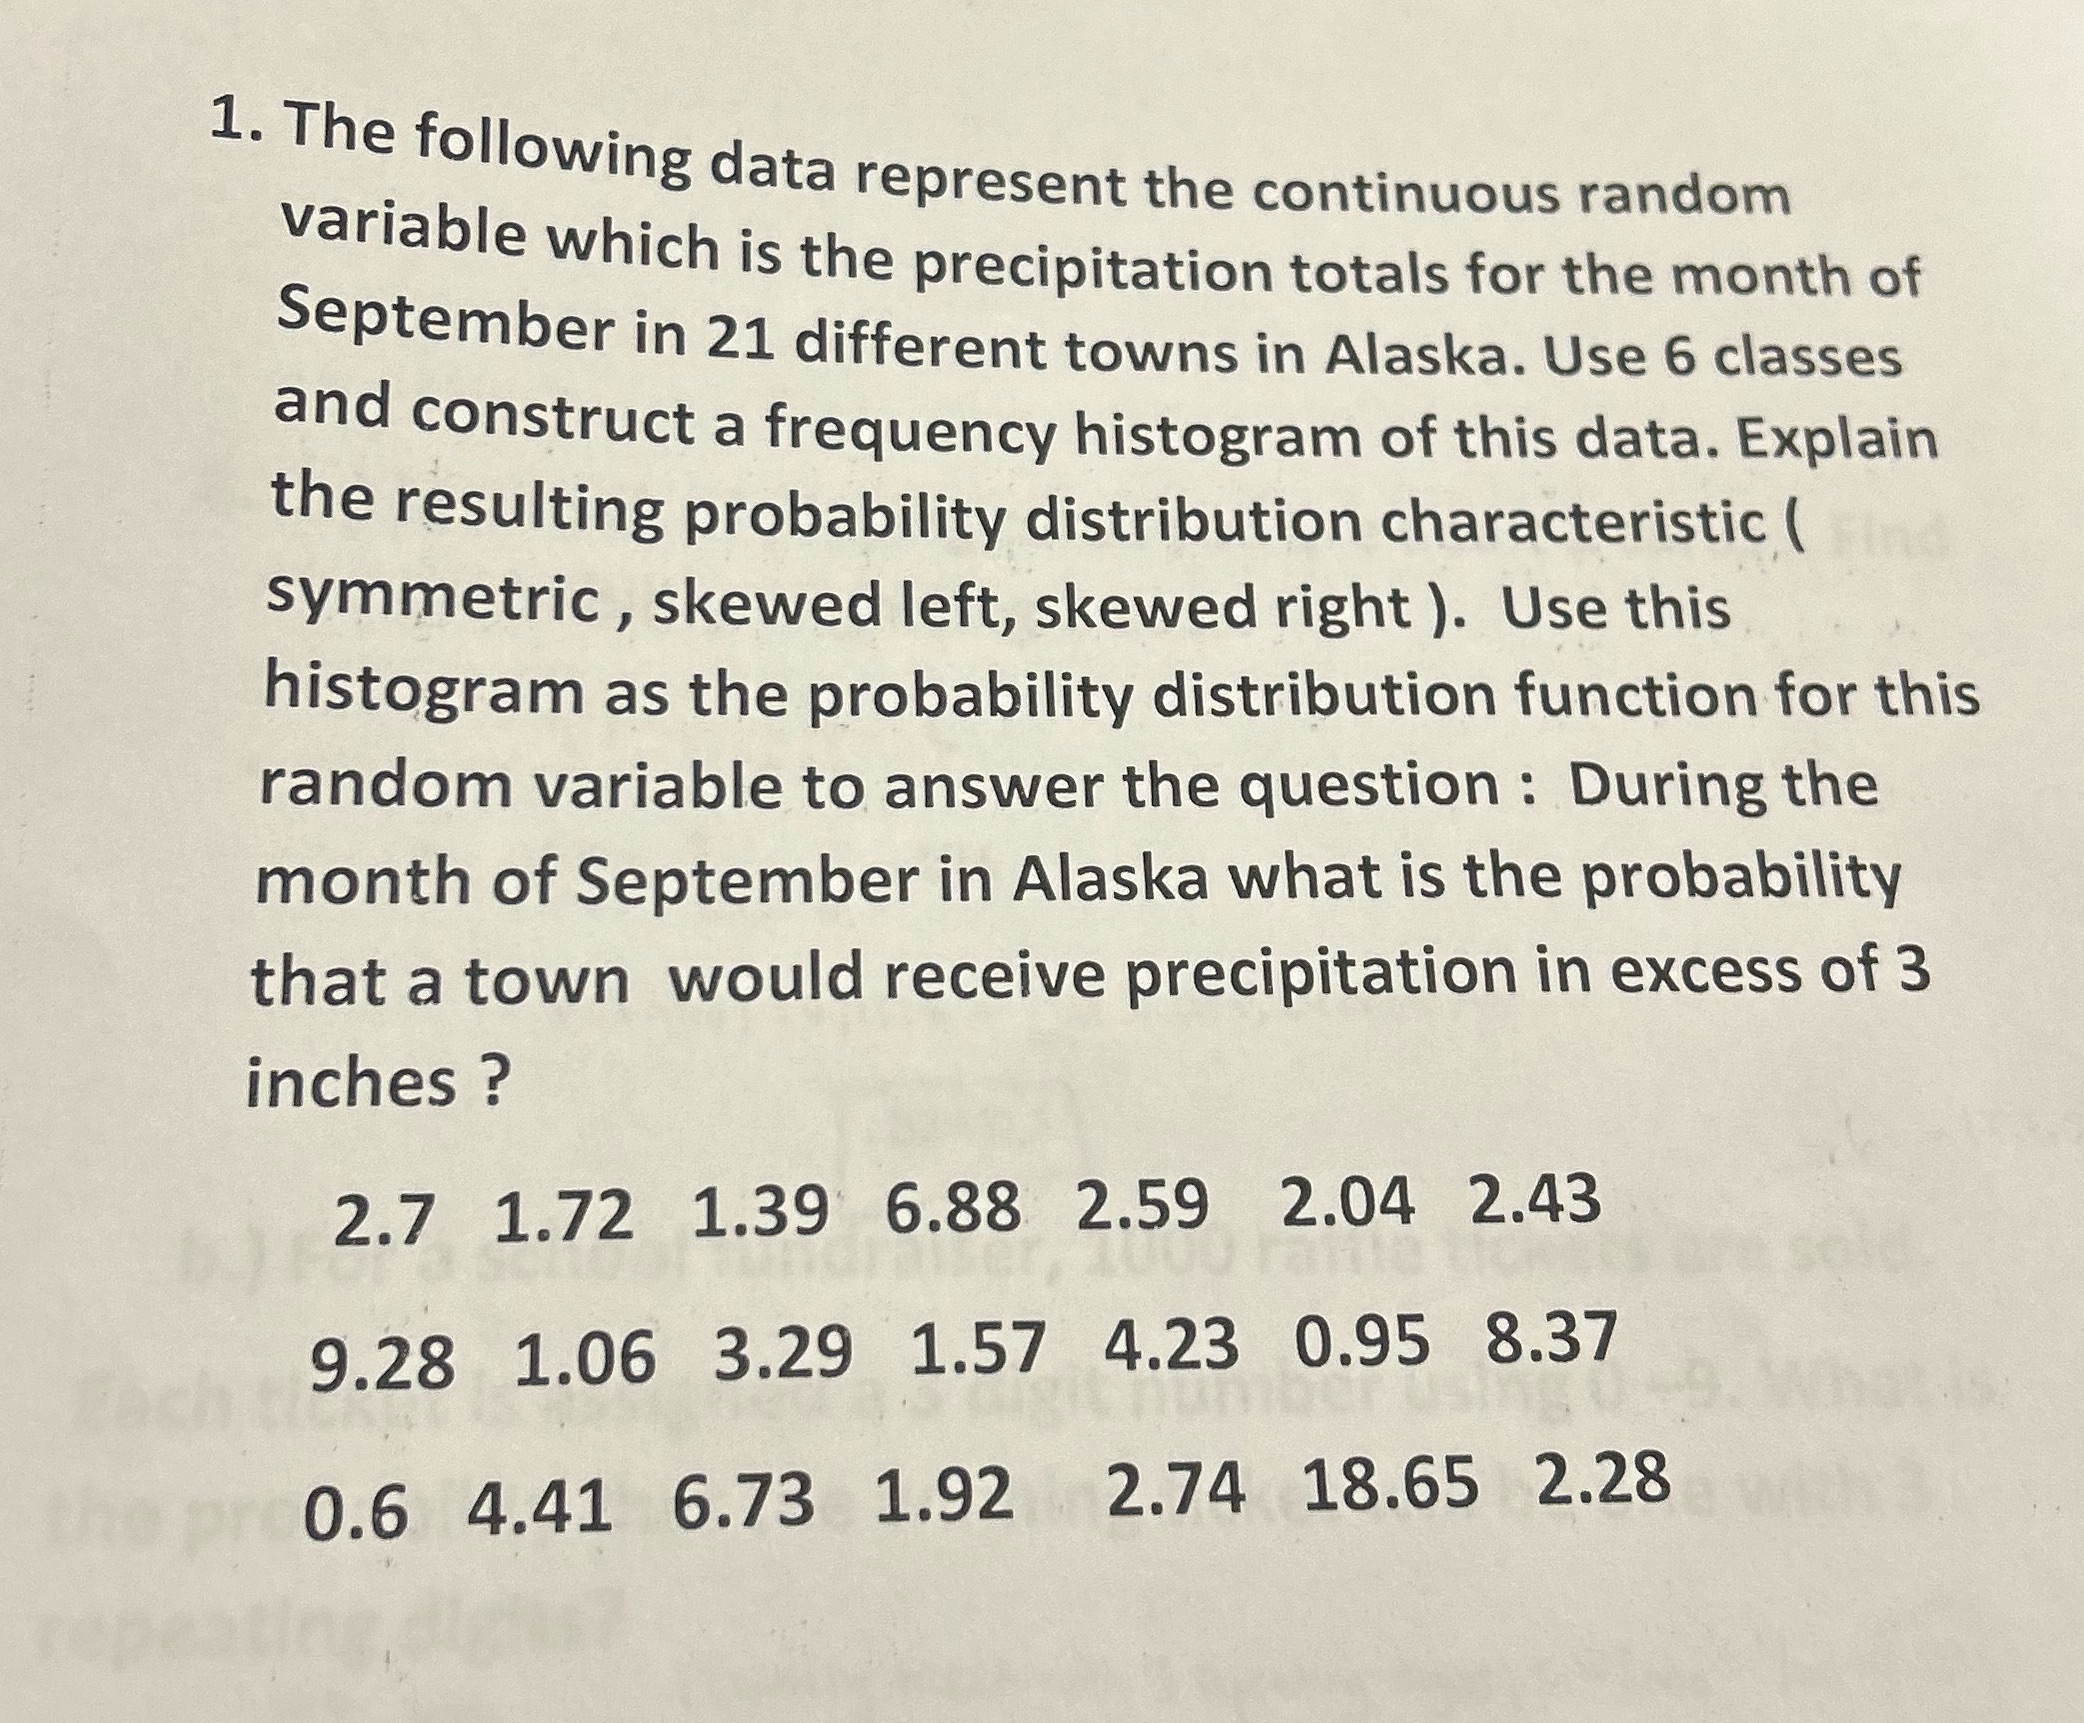
1. The following data represent the continuous random variable which is the precipitation totals for the month of September in 21 different towns in Alaska. Use 6 classes and construct a frequency histogram of this data. Explain the resulting probability distribution characteristic ( symmetric , skewed left, skewed right ). Use this histogram as the probability distribution function for this random variable to answer the question : During the month of September in Alaska what is the probability that a town would receive precipitation in excess of 3 inches ? 2.7 1.72 1.39 6.88 2.59 2.04 2.43 9.28 1.06 3.29 1.57 4.23 0.95 8.37 0.6 4.41 6.73 1.92 2.74 18.65 2.28
Step by Step Solution
There are 3 Steps involved in it

Get step-by-step solutions from verified subject matter experts