

Question: 1. The following graph is a residual plot derived from a scatterplot that predicted the height of girls from their ages (in years). A. Does
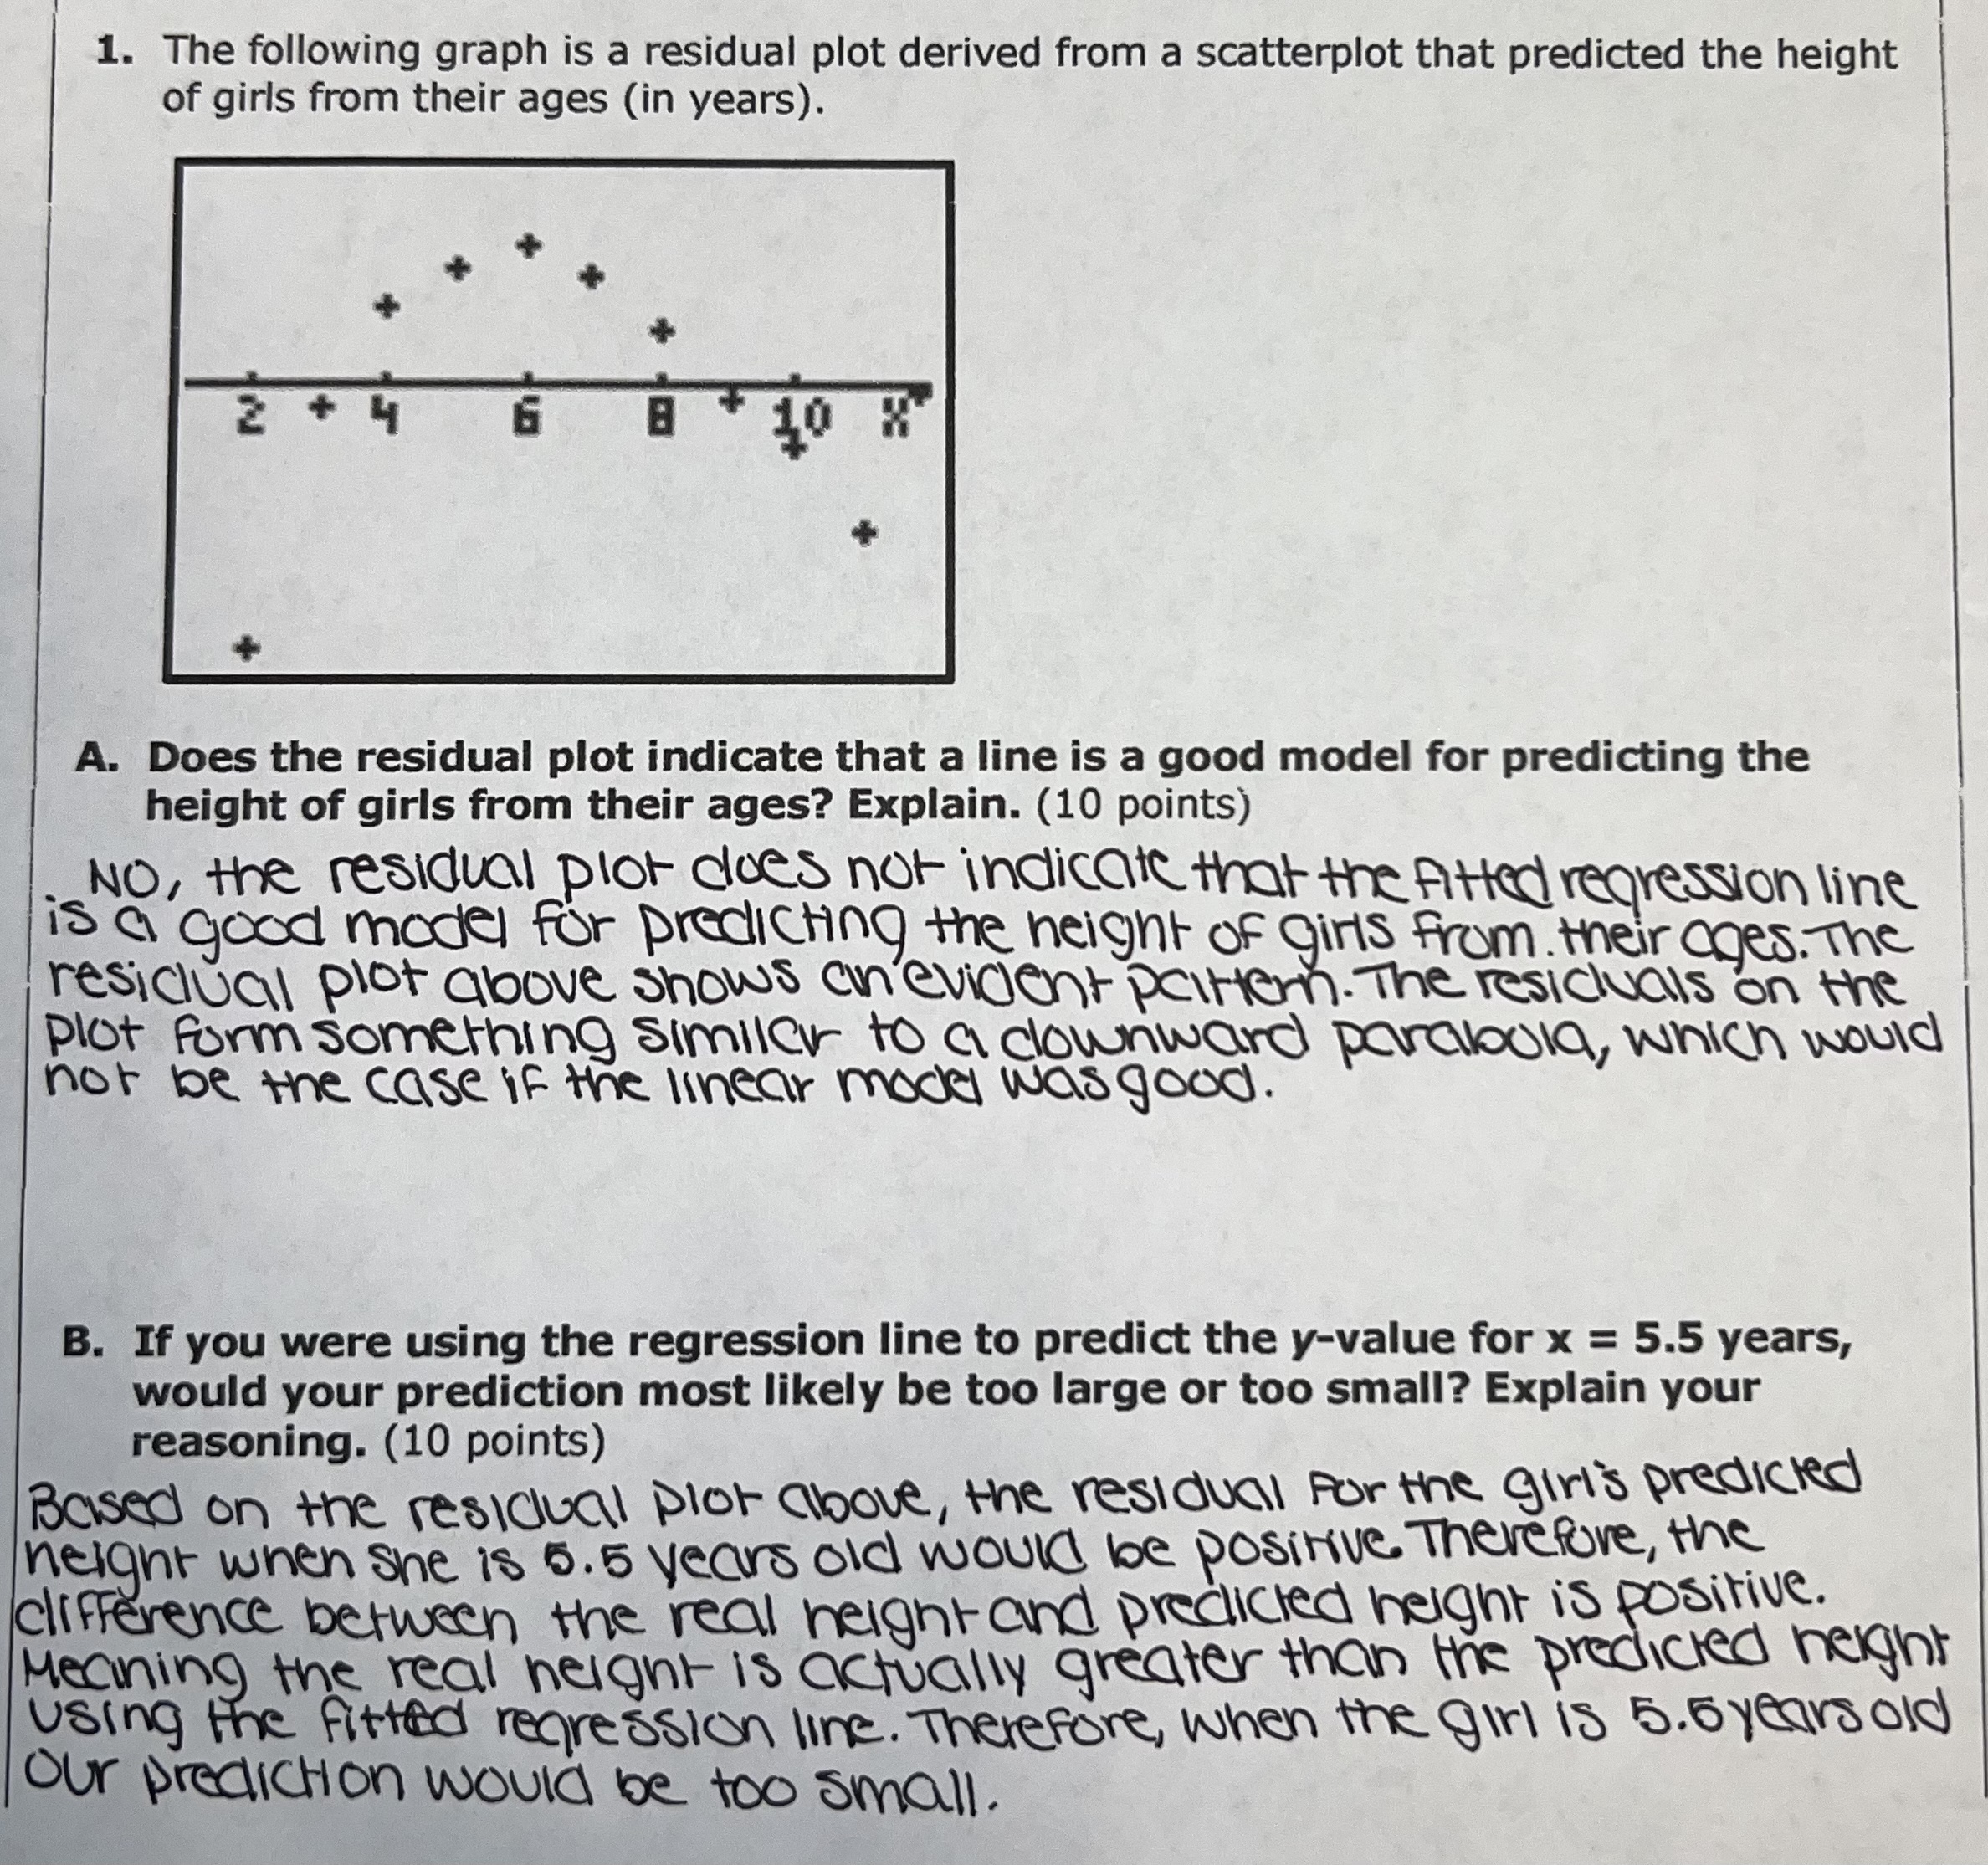

1. The following graph is a residual plot derived from a scatterplot that predicted the height of girls from their ages (in years). A. Does the residual plot indicate that a line is a good model for predicting the height of girls from their ages? Explain. (10 points) NO, the residual plot does not indicate that the fitted regression line is a good model for predicting the height of girls from their ages. The residual plot above shows an evident pattern. The residuals on the Plot form something similar to a downward parabola, which would not be the case if the linear model was good. B. If you were using the regression line to predict the y-value for x = 5.5 years, would your prediction most likely be too large or too small? Explain your reasoning. (10 points) Based on the residual plot above, the residual for the girl's predicted height when she is 5.5 years old would be positive. Therefore, the clifference between the real height and predicted height is positive. Meaning the real height is actually greater than the predicted height using the fitted regression line. Therefore, when the girl is 5.5 years old our prediction would be too small
Step by Step Solution
There are 3 Steps involved in it

Get step-by-step solutions from verified subject matter experts