

Question: 1. The following R code was written to study relation between variables y, x1, and X2. Unfortunately, coffee was spilled on the output, and some
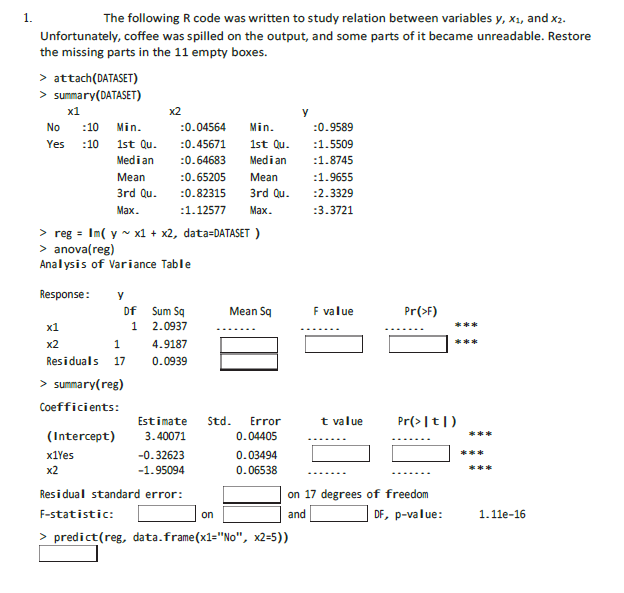
1. The following R code was written to study relation between variables y, x1, and X2. Unfortunately, coffee was spilled on the output, and some parts of it became unreadable. Restore the missing parts in the 11 empty boxes. > attach (DATASET) > summary (DATASET) x1 x2 y No :10 Min. :0.04564 Min. :0.9589 Yes :10 1st Qu. :0.45671 1st Qu. :1.5509 Median :0.64683 Median :1.8745 Mean :0.65205 Mean :1.9655 3rd Qu. :0.82315 3rd Qu. :2.3329 Max. :1.12577 Max. :3.3721 > reg = Im( y ~ x1 + x2, data=DATASET ) > anova(reg) Analysis of Variance Table Response : y Df Sum 5q Mean Sq F value Pr (>F) x1 1 2.0937 x2 1 4.9187 * kk Residuals 17 0.0939 > summary (reg) Coefficients: Estimate Std. Error t value Pr(> | +1 ) (Intercept) 3. 40071 0. 04405 x1Yes -0. 32623 0. 03494 x2 -1.95094 0. 06538 Residual standard error: on 17 degrees of freedom F-statistic: on and |DF, p-value: 1. 11e-16 > predict(reg, data. frame(x1="No", x2=5))
Step by Step Solution
There are 3 Steps involved in it

Get step-by-step solutions from verified subject matter experts