

Question: 1. The following table shows the time and concentration data for a flow in the reactor 1 3 81 5 90 time Tracer concentration time
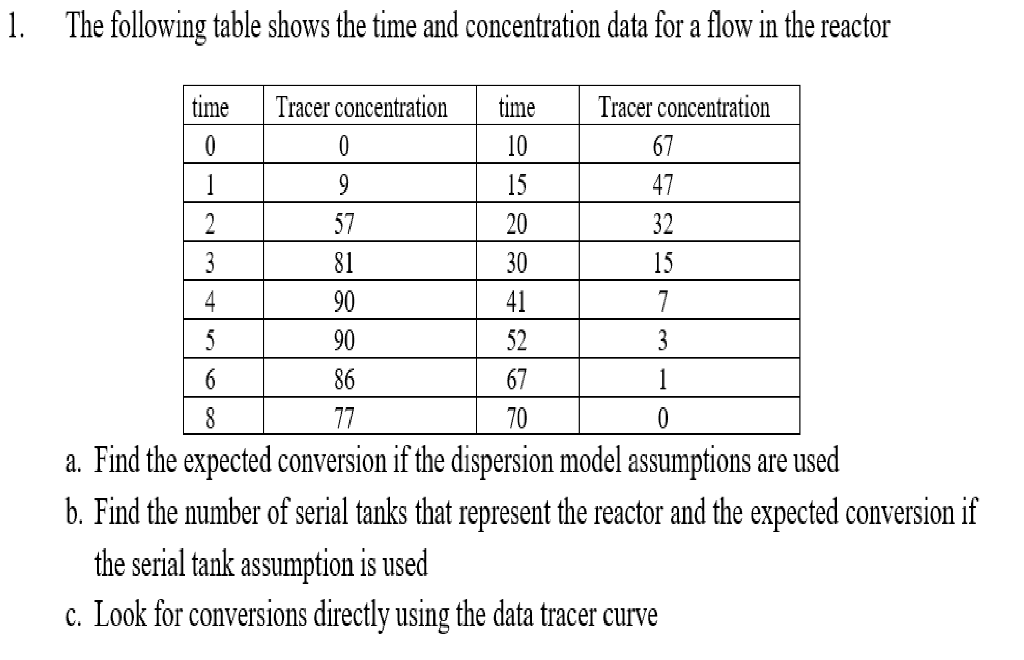
1. The following table shows the time and concentration data for a flow in the reactor 1 3 81 5 90 time Tracer concentration time Tracer concentration 0 10 67 9 15 47 2 57 20 32 30 15 4 90 41 7 52 3 6 86 67 1 8 77 70 0 a. Find the expected conversion if the dispersion model assumptions are used b. Find the number of serial tanks that represent the reactor and the expected conversion if the serial tank assumption is used c. Look for conversions directly using the data tracer curve
Step by Step Solution
There are 3 Steps involved in it
1 Expert Approved Answer
Step: 1 Unlock

Question Has Been Solved by an Expert!
Get step-by-step solutions from verified subject matter experts
Step: 2 Unlock
Step: 3 Unlock