Question: 1. The function f graphed below is defined by a polynomial expression of degree 4. Use the graph to solve the exercise. 3 (a) A
1.
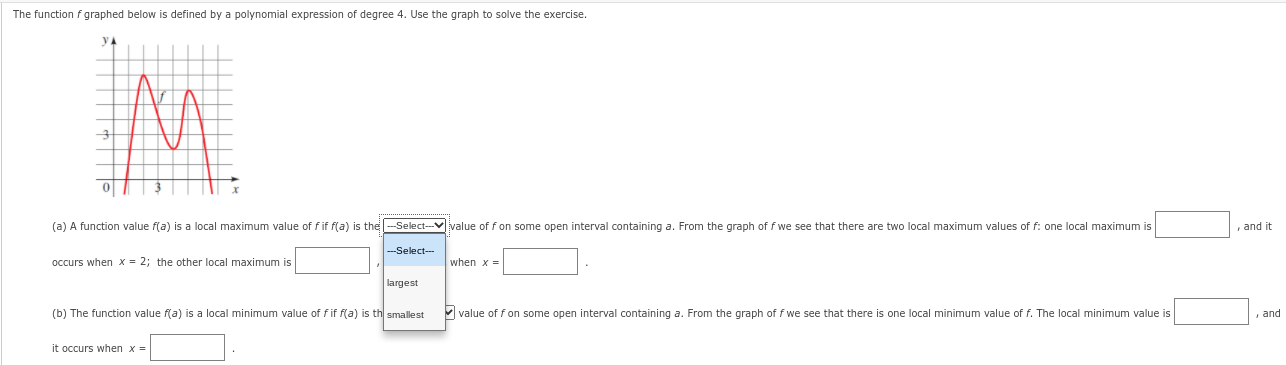
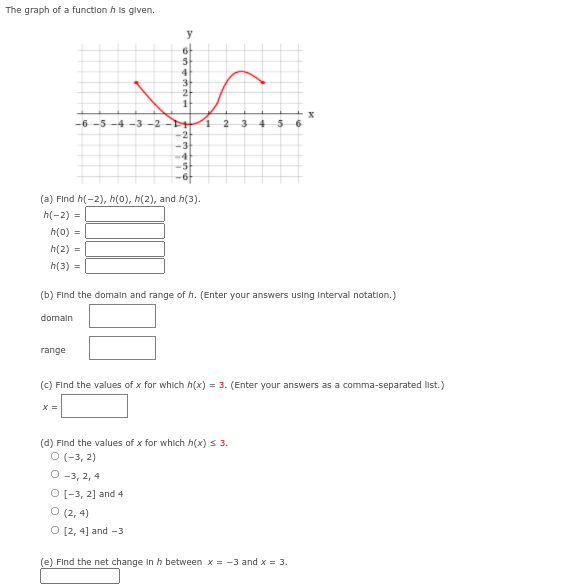
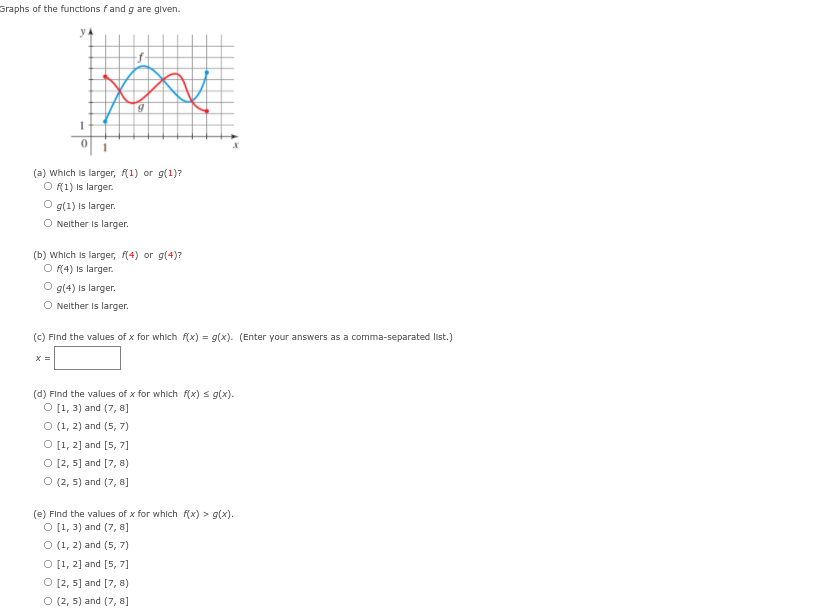
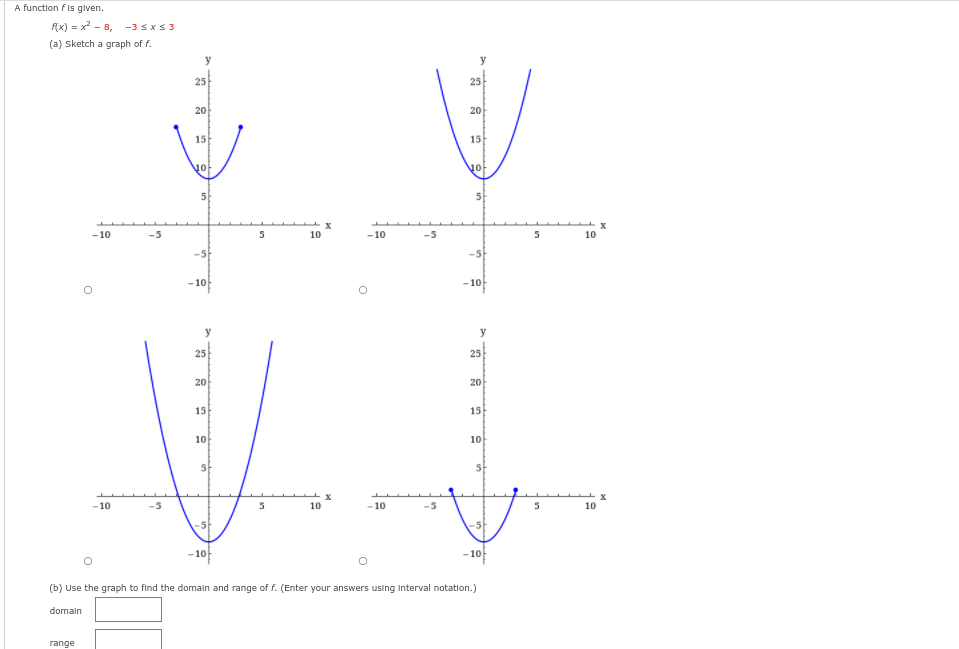
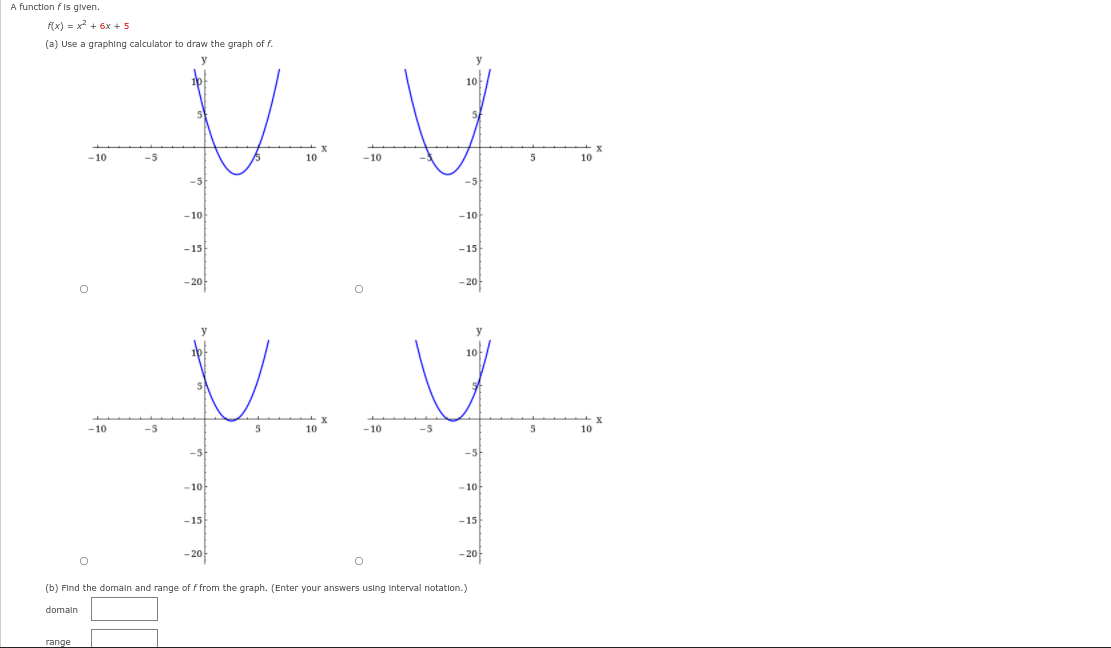
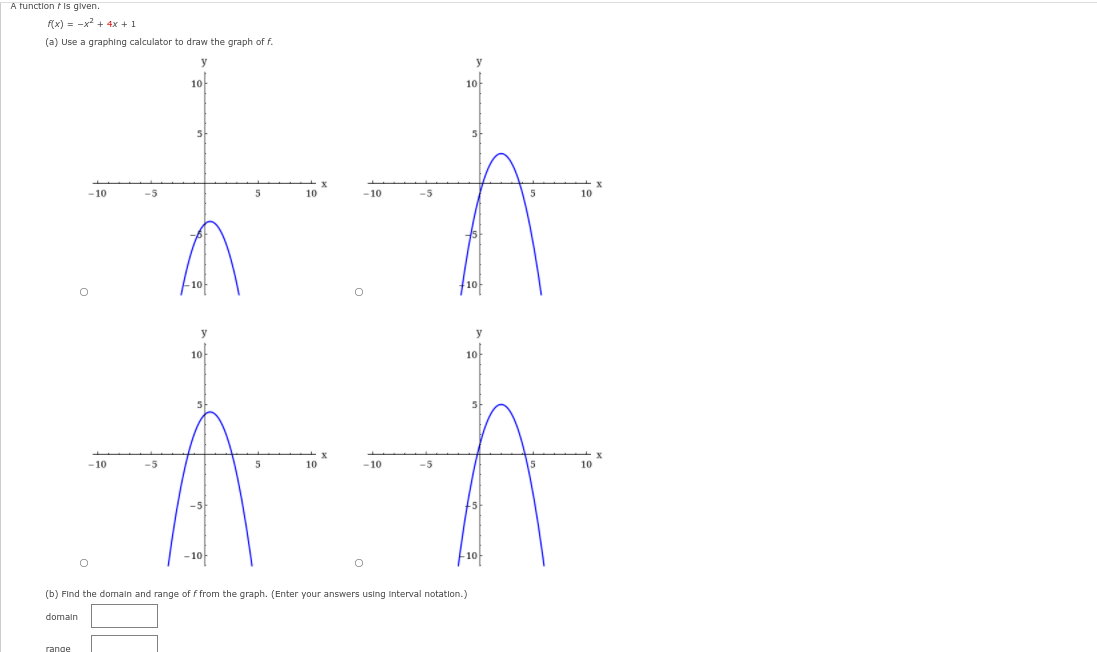
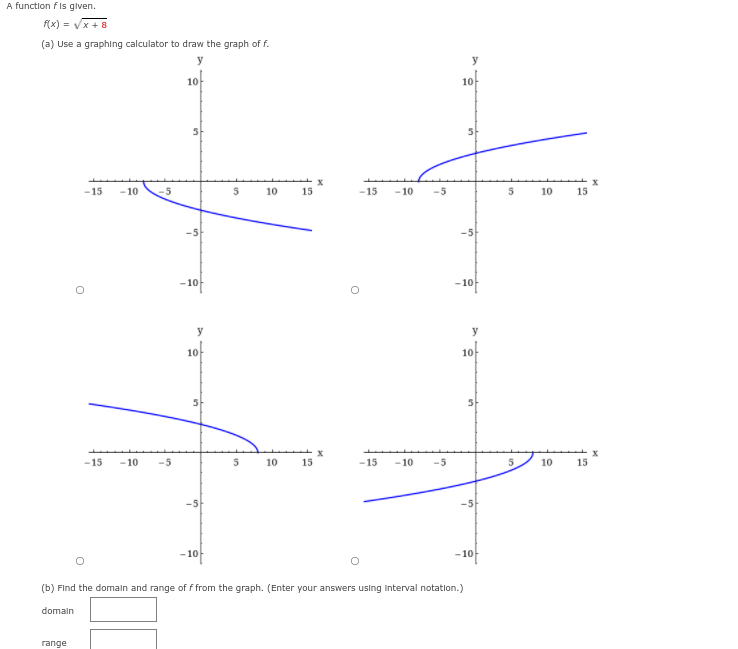
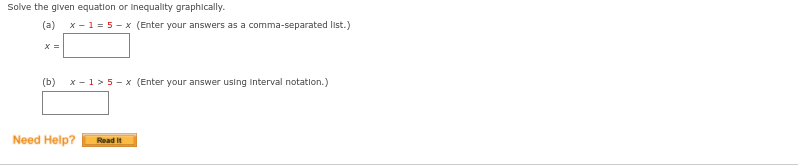
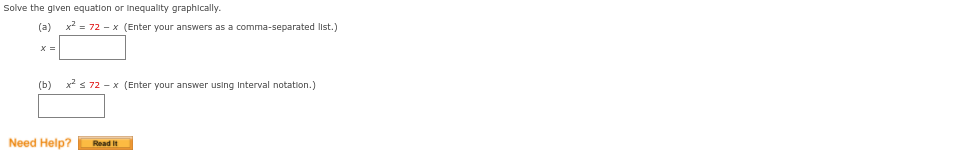
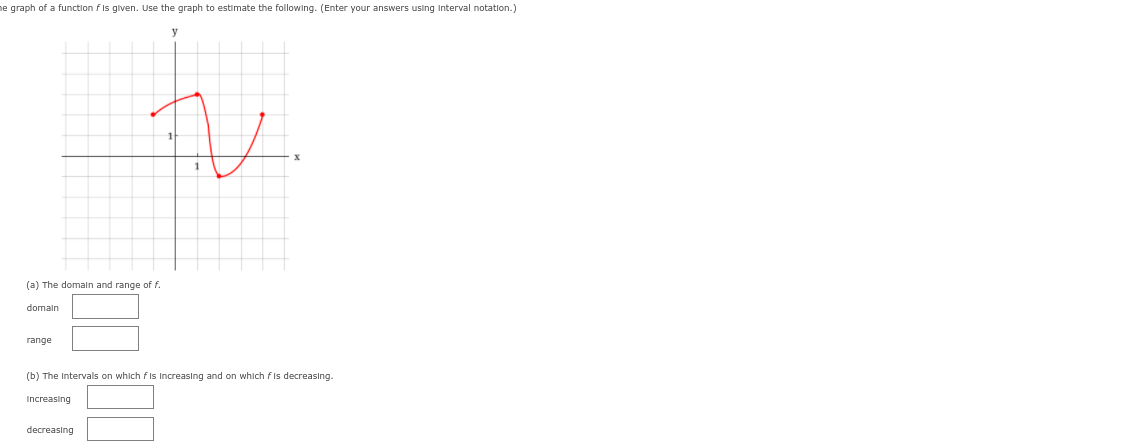
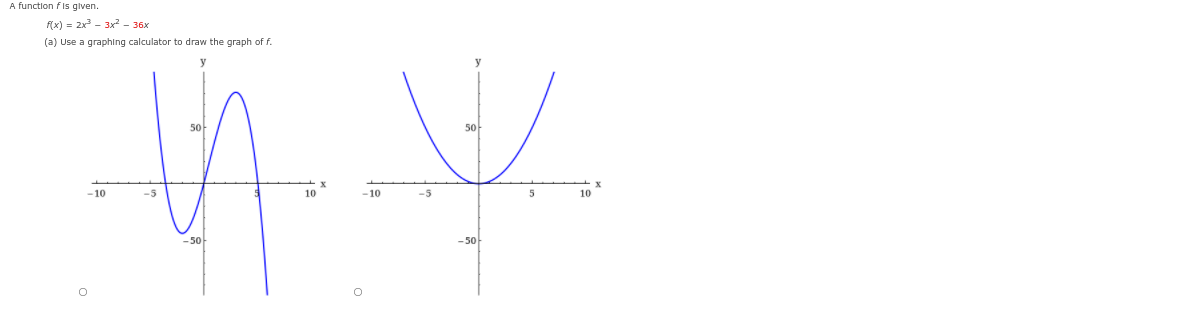
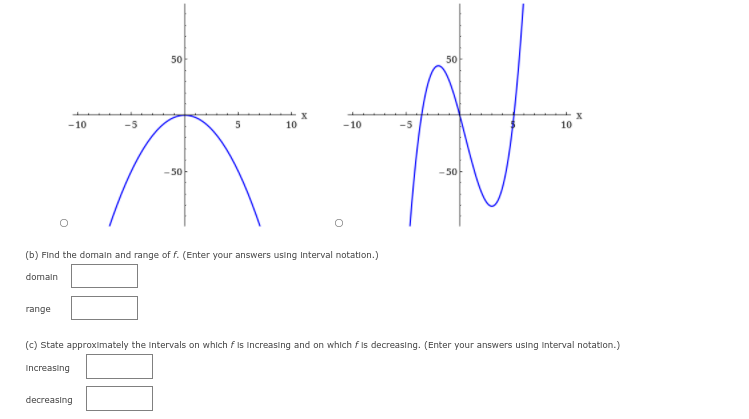
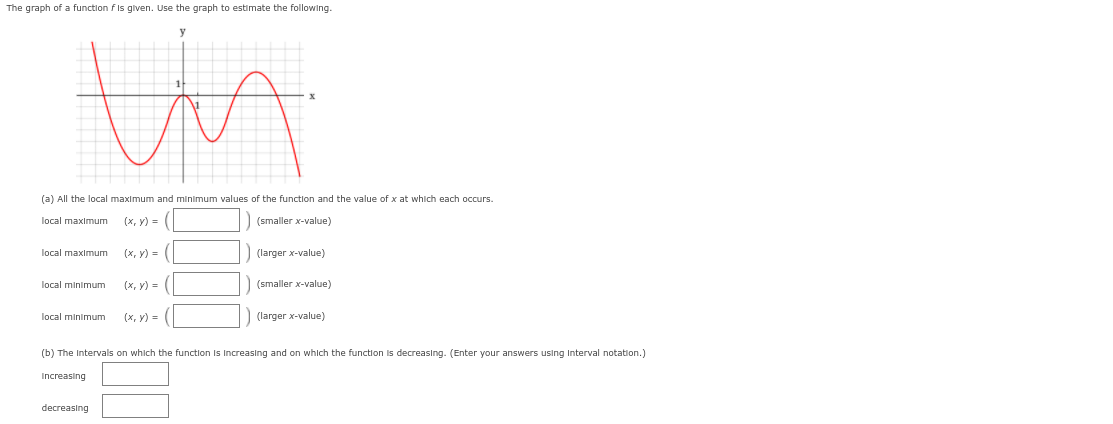
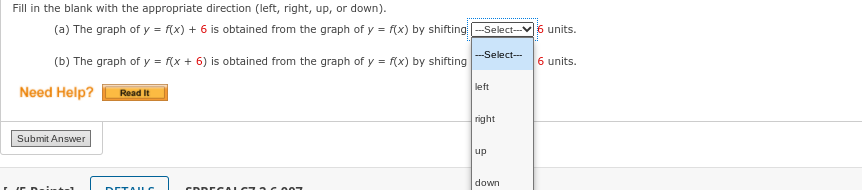
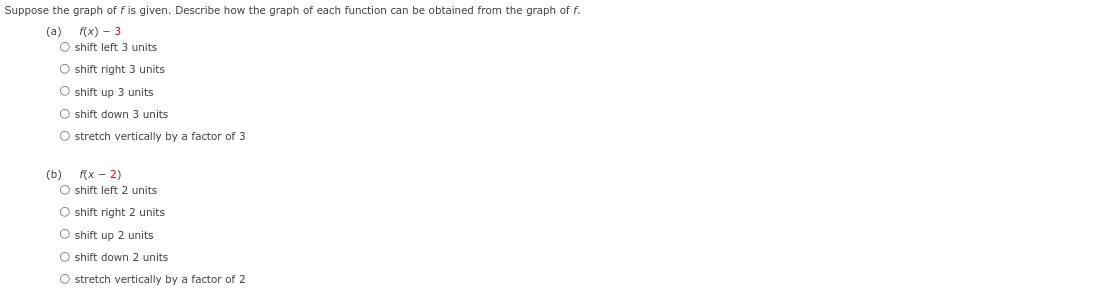
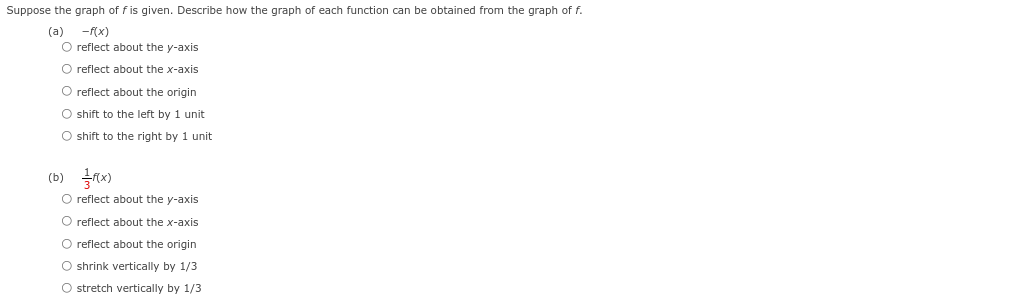
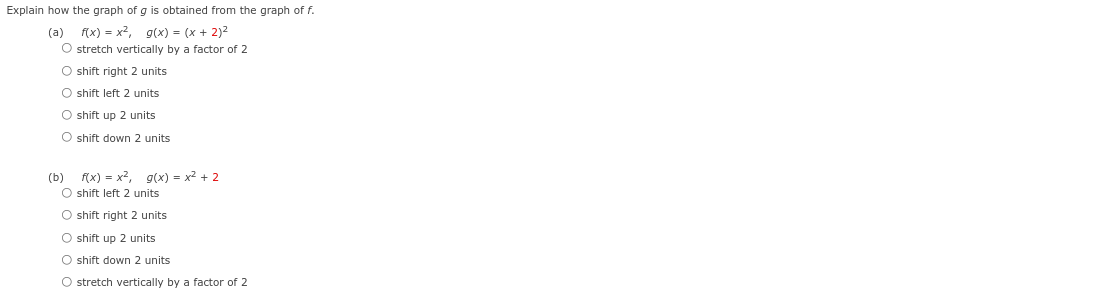
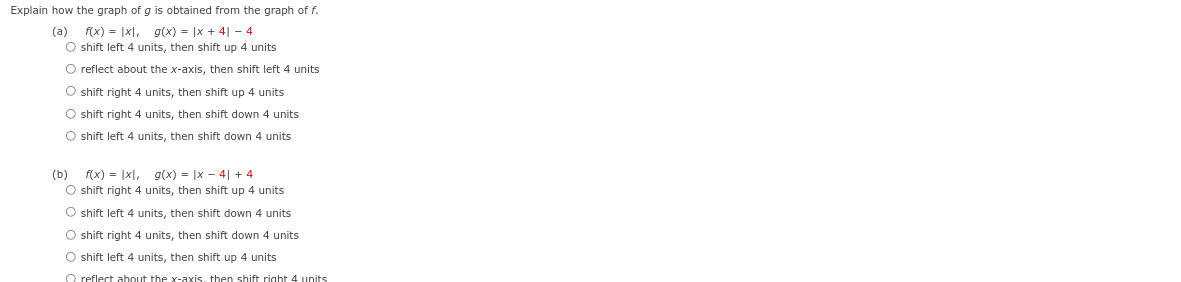
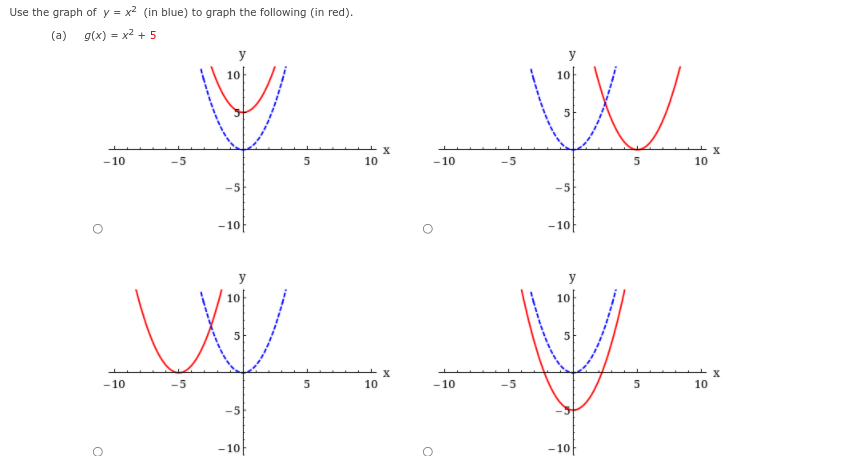
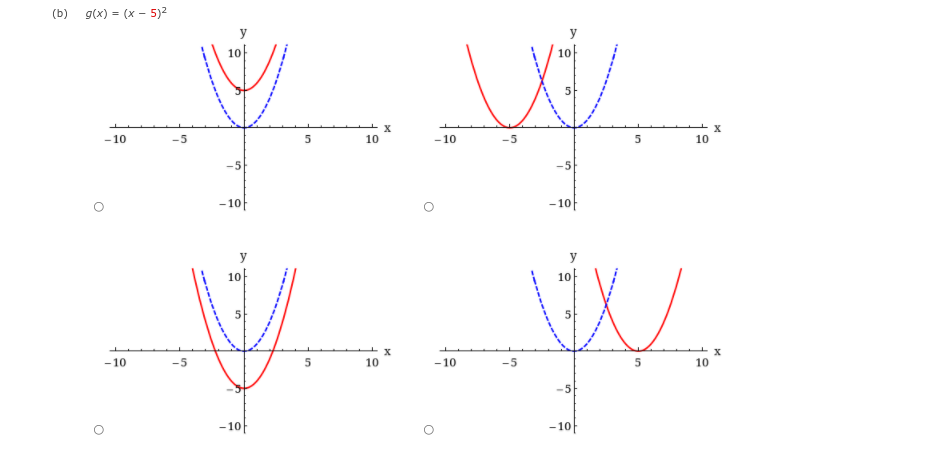
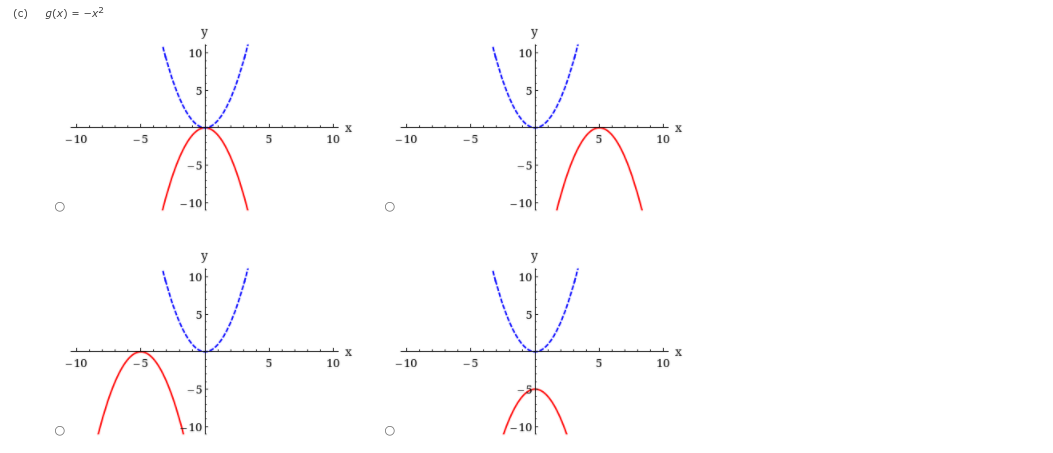
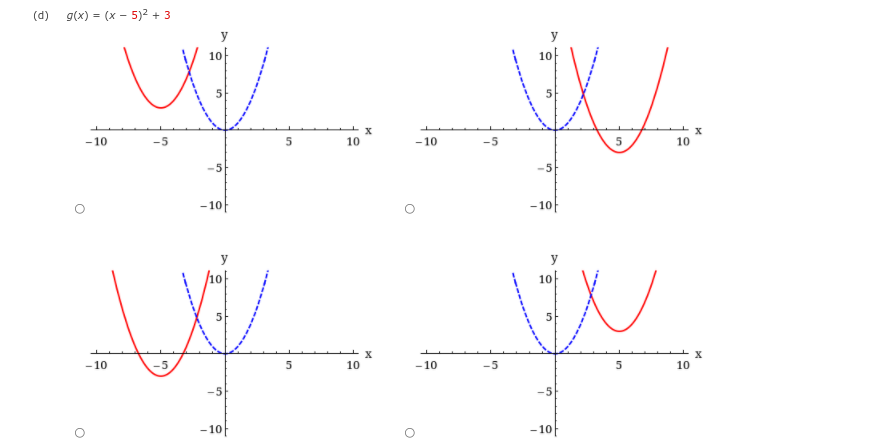
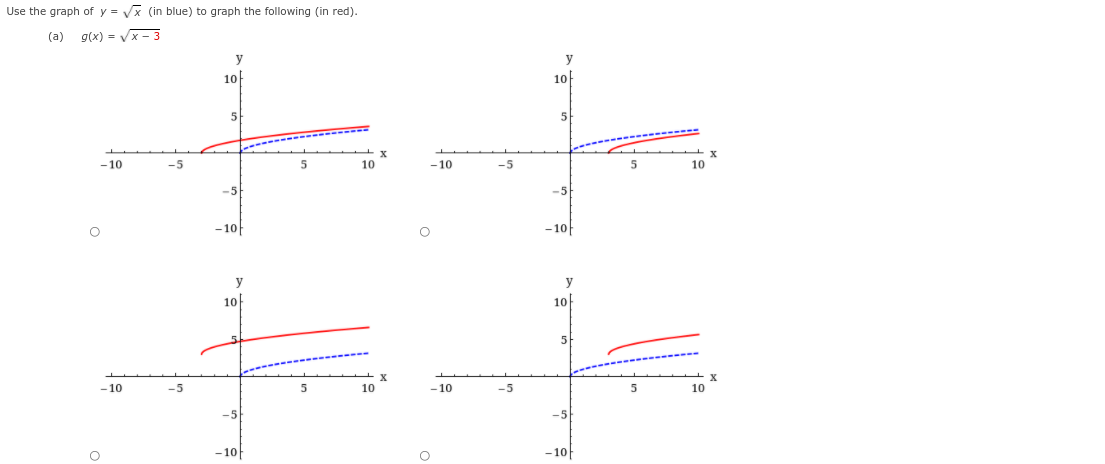
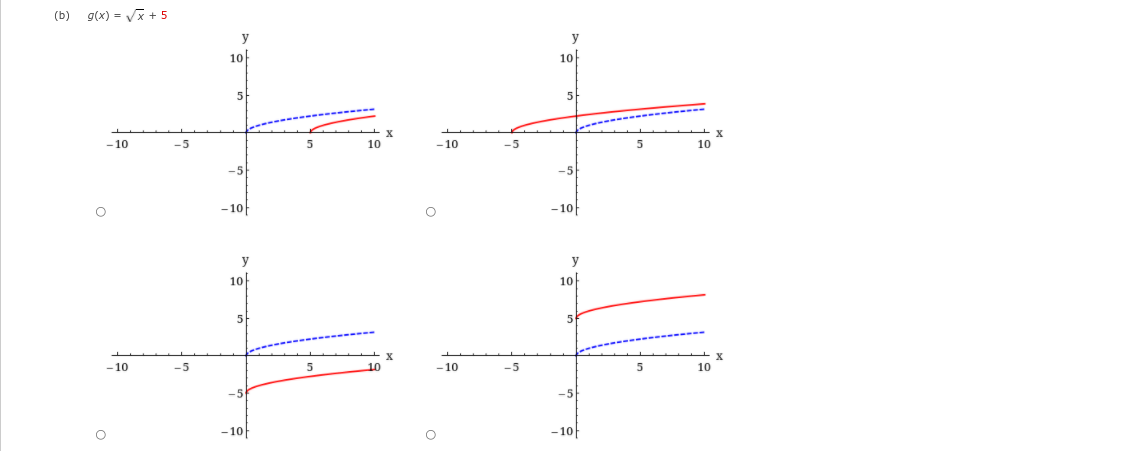
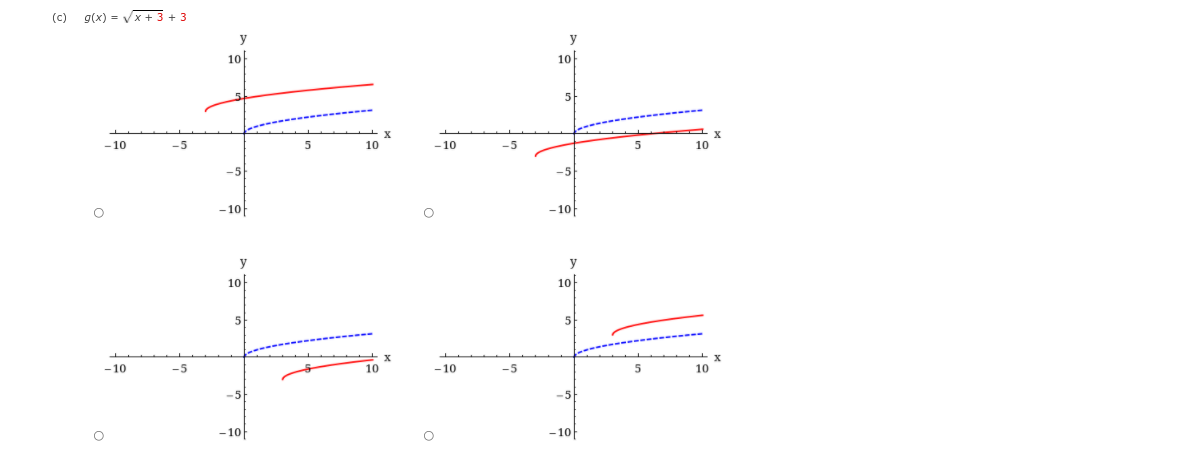
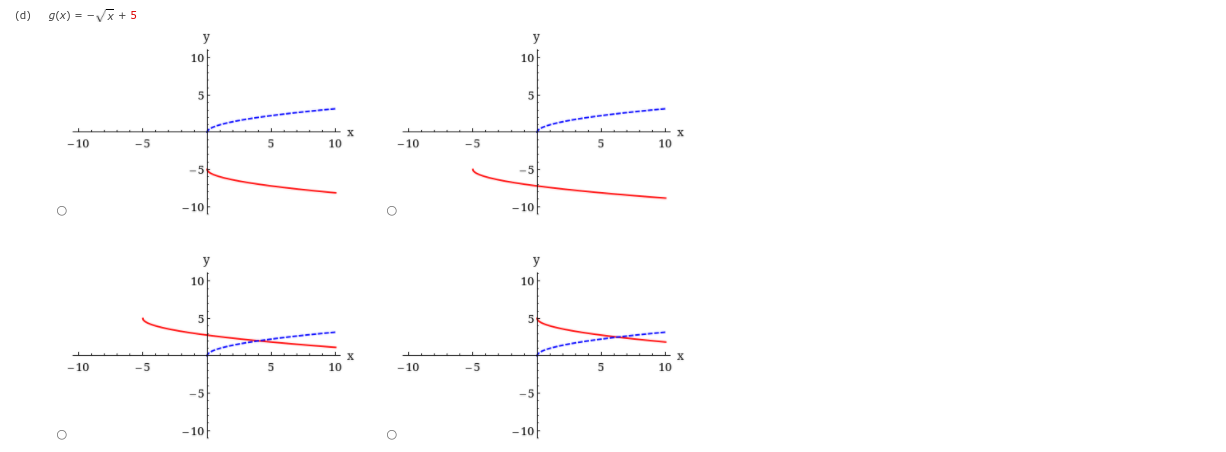
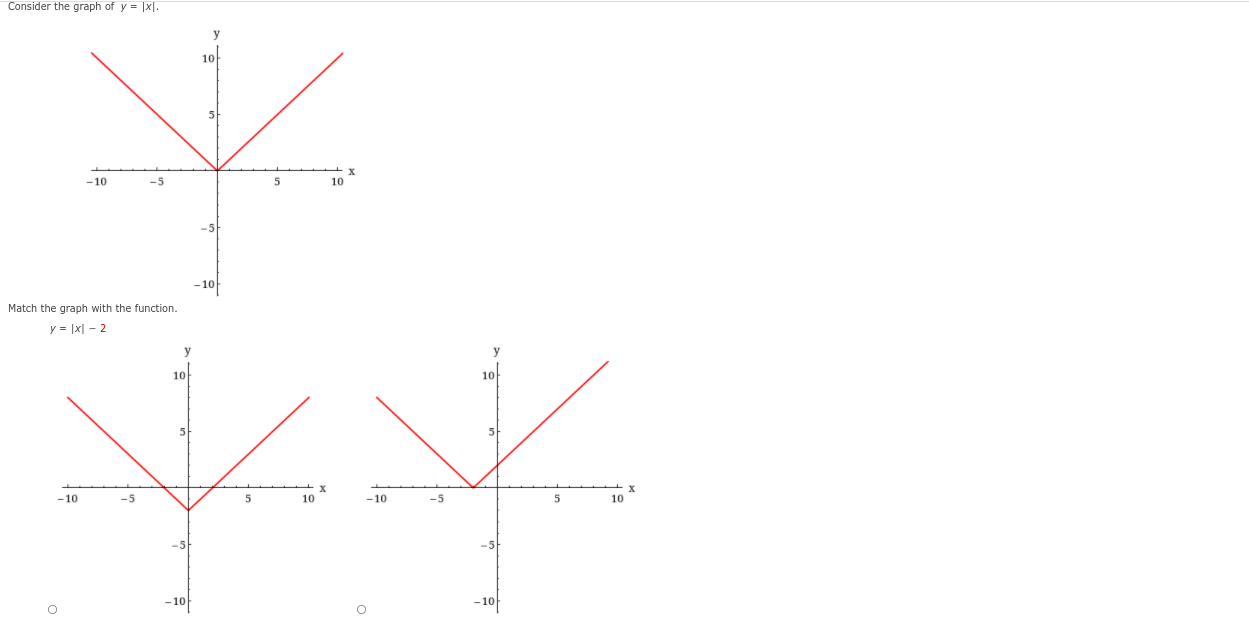
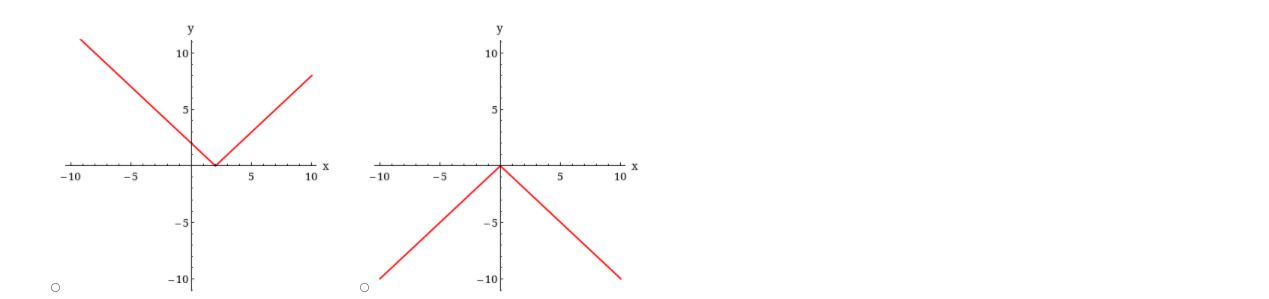
The function f graphed below is defined by a polynomial expression of degree 4. Use the graph to solve the exercise. 3 (a) A function value f(a) is a local maximum value of fif f(a) is the -Select-- value of f on some open interval containing a. From the graph of f we see that there are two local maximum values of f: one local maximum is and it --Select-- occurs when x = 2; the other local maximum is when x = largest (b) The function value f(a) is a local minimum value of fif f(a) is the smallest value of f on some open interval containing a. From the graph of f we see that there is one local minimum value of f. The local minimum value is and it occurs when x =The graph of a function h Is given. X -6 -5-4-3-2-14 234 5 6- -5 -6 (a) Find h(-2), h(0), h(2), and h(3). h(-2) = h(0) = h (2) = h(3) = (b) Find the domain and range of h. (Enter your answers using Interval notation.) domain range (c) Find the values of * for which h(x) = 3. (Enter your answers as a comma-separated list.) * = (d) Find the values of x for which h(x) $ 3. O (-3, 2) 0 -3, 2, 4 O [-3, 2] and 4 O (2, 4) O [2, 4] and -3 (e) Find the net change In h between x = -3 and x = 3.Graphs of the functions fand g are given. (a) Which Is larger, A(1) or g(1)? O A( 1) Is larger. O g(1) Is larger. O Neither Is larger. (b) which is larger, /(4) or g(4)? O f(4) Is larger. O g(4) Is larger. O Neither Is larger. (c) Find the values of x for which A(x) = g(x). (Enter your answers as a comma-separated list.) * : (d) Find the values of x for which A(x) s g(x). [1, 3) and (7, 8 ] O (1, 2) and (5, 7) O [1, 2] and [5, 7] O [2, 5] and [7, a) O (2, 5) and (7, 8 ] (e) Find the values of x for which f(x) > g(x). O [1, 3) and (7, 8] O (1, 2) and (5, 7) O [1, 2] and [5, 7] O [2, 5] and [7, 8) O (2, 5) and (7, 8 ]A function f is given. Ax) = x - 6, -35x53 (a) Sketch a graph of f. 254 25- 20 20 15 5 LX -10 -5 5 10 -10 5 10 -5 -5 - 10 - 10 O O 25 25 20 20 15 15 10 10 LX -10 -5 10 -10 10 -5/ - 10 - 10 (b) Use the graph to find the domain and range of f. (Enter your answers using Interval notation.) domain rangeA function f is given. f(x) = x + 6x+5 (a) Use a graphing calculator to draw the graph of f. 10 51 -10 -5 . X 10 -10 5 10 -5 -5 - 10 - 10 -15 - 15 O -20 O -20 10 5 -10 -5 X 5 10 -10 X -5 5 10 -5 -5 -10 - 10 -15 -15 O -20 O -20 (b) Find the domain and range of f from the graph. (Enter your answers using Interval notation.) domainA function / Is given. f(x) = -x2 + 4x+ 1 (a) use a graphing calculator to draw the graph of f. 10 10 X - X -10 -5 5 10 -10 -5 5 10 10 O O 10 10 5- X - X -10 -5 5 10 -10 -5 5 10 -5 -10 10 O (b) Find the domain and range of ffrom the graph. (Enter your answers using Interval notation.) domainA function fis given. Ax) = vx+8 (a) use a graphing calculator to draw the graph of f. y 10 10 51 -15 -10 -5 5 10 15 -15 -10 - X -5 5 10 15 -5 -5 -106 O -10 O 10 10 - X -15 -10 -5 10 15 -15 -10 - X -5 5 10 15 -5 -5 - 10 O - 10 O (b) Find the domain and range of f from the graph. (Enter your answers using Interval notation.) domain rangeSolve the given equation or Inequality graphically. (a) x - 1 = 5 - x (Enter your answers as a comma-separated list.) (b) x - 1 > 5 - x (Enter your answer using Interval notation.) Need Help? Read ItSolve the given equation or Inequality graphically. (a) xz = 72 - x (Enter your answers as a comma-separated list.) (b) x2 $ 72 - x (Enter your answer using Interval notation.) Need Help? Read Ite graph of a function fis given. Use the graph to estimate the following. (Enter your answers using Interval notation.) (a) The domain and range of f. domain range (b) The Intervals on which fis Increasing and on which fis decreasing. Increasing decreasingA function f is given. f(x) = 2x3- 3x - 36X (a) use a graphing calculator to draw the graph of f. 50 50 X - X -10 10 -10 -5 5 10 -50 -50 O O50 50 -10 -5 5 10 -10 -5 10 -50 -50 O O (b) Find the domain and range of f. (Enter your answers using Interval notation.) domain range (c) State approximately the Intervals on which f is Increasing and on which f is decreasing. (Enter your answers using Interval notation.) Increasing decreasingThe graph of a function fis given. Use the graph to estimate the following. (a) All the local maximum and minimum values of the function and the value of x at which each occurs. local maximum (x , y ) = (smaller x-value) local maximum ( x , y ) = (larger x-value) local minimum ( x , y ) = (smaller x-value) local minimum ( x , y ) = (larger x-value) (b) The Intervals on which the function Is Increasing and on which the function Is decreasing. (Enter your answers using Interval notation.) Increasing decreasingFill in the blank with the appropriate direction (left, right, up, or down). (a) The graph of y = ((x) + 6 is obtained from the graph of y = ((x) by shifting ---Select--v 6 units. -Select--- (b) The graph of y = ((x + 6) is obtained from the graph of y = ((x) by shifting 6 units. Need Help? left Read It right Submit Answer up downSuppose the graph of fis given. Describe how the graph of each function can be obtained from the graph of f. (a) f(x) - 3 O shift left 3 units O shift right 3 units O shift up 3 units O shift down 3 units O stretch vertically by a factor of 3 (b) f( x - 2) O shift left 2 units O shift right 2 units O shift up 2 units O shift down 2 units O stretch vertically by a factor of 2Suppose the graph of (is given. Describe how the graph of each function can be oblained from the graph of f. (a) 4U!) 0 reflect about the y-axis 0 reflect about the x-axis 0 reflect about the origin 0 shift to the lefl: by 1 unit 0 shift to the right by 1 unit (bi tan 0 reflect about the yaxis 0 reflect about the x-axis 0 reflect about the origin 0 shrink vertically by 133 O stretch vertically by 133 Explain how the graph mg is obtained from the graph of f. (a) M) = x2. 900 = (X + 212 O stretch vertically by a factor of 2 0 shift right 2 units 0 shift left 2 units 0 shift up 2 units 0 shift down 2 units (b) x) = :8. 90:) = x2 + 2 0 shift left 2 units 0 shift right 2 units 0 shift up 2 null: 0 shift down 2 units 0 stretch vertically by a factor of 2 Explain how the graph of g is obtained from the graph of f. (a) f(x) = Ixl, g(x) = |x + 41 - 4 O shift left 4 units, then shift up 4 units O reflect about the x-axis, then shift left 4 units O shift right 4 units, then shift up 4 units O shift right 4 units, then shift down 4 units O shift left 4 units, then shift down 4 units (b) A(x) = 1x1, g(x) = 1x - 41 +4 O shift right 4 units, then shift up 4 units O shift left 4 units, then shift down 4 units O shift right 4 units, then shift down 4 units O shift left 4 units, then shift up 4 unitsUse the graph of y = x2 {in blue) to graph the following {in red}. (5} gm = 21 + 5 (b) g(x) = (x - 5)2 106 106 -10 -5 -X 5 10 -10 -5 X 5 10 -5 -5 O -10 O -10 y 10- 106 5 -10 -5 X 5 10 -10 -5 X 5 10 O -10 O -10\f(d) g(x) = (x - 5)2 + 3 y 10- 10 5 5 X -10 -5 L X 5 10 -10 -5 5 10 -5 -5 O -10 O -10 y 10 Ax - X -10 L X 5 10 -10 -5 5 10 -5 -5 O -10 O -10Use the graph of y = J} {in blue) to graph the following {in red}. (a) 9(XII=v"X-3 (b) g(x) = vx+5 10/ 10/ 5 5 -10 -5 X 5 10 -10 -5 X 5 10 -5 -5 O -10 O -10 10/ 10/ 5 5 -10 -5 X 5 10 -10 -5 X 5 10 -5 -5 O -10 O -10\f\fConsider the graph of y = [x|. 10 5 -10 -5 X 5 10 -5 -10 Match the graph with the function. y = Ixl - 2 10 10 5 51 -10 -5 X 5 10 -10 -5 X 5 10 -5 -51 O -10 O - 1010 10 5 5 -10 -5 X 10 -10 -5 5 X 10 -5 -5 O -10 O -10
Step by Step Solution
There are 3 Steps involved in it
1 Expert Approved Answer
Step: 1 Unlock
Question Has Been Solved by an Expert!
Get step-by-step solutions from verified subject matter experts
Step: 2 Unlock
Step: 3 Unlock
Students Have Also Explored These Related Mathematics Questions!