

Question: 1. The functionrepresents the number of specialty items produced at the old factory w weeks after a change in management. The graph represents the number
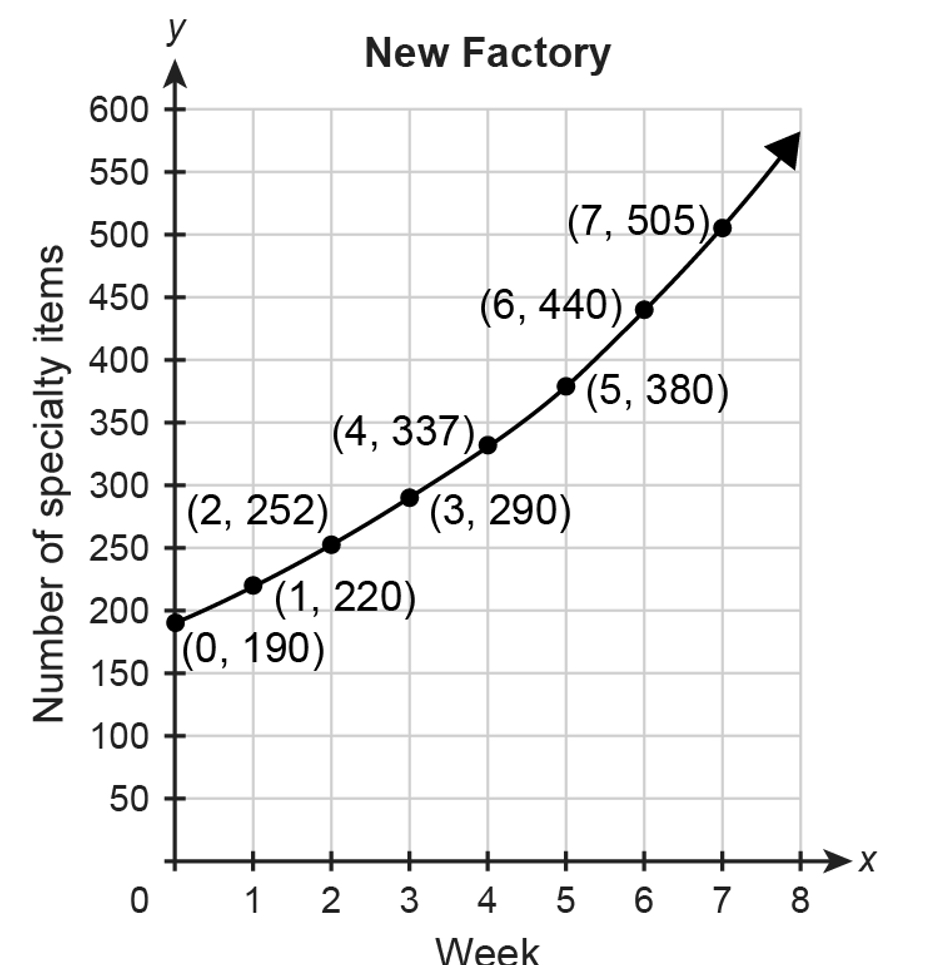
1.The functionrepresents the number of specialty items produced at the old factorywweeks after a change in management. The graph represents the number of specialty items produced at the new factory during the same time period.
(a)During Week 0, how many more specialty items were produced at the old factory than at the new factory? Explain.
(b)Find and compare the growth rates in the weekly number of specialty items produced at each factory. Show your work.
(c)When does the weekly number of specialty items produced at the new factory exceed the weekly number of specialty items produced at the old factory? Explain.
\f
Step by Step Solution
There are 3 Steps involved in it
1 Expert Approved Answer
Step: 1 Unlock

Question Has Been Solved by an Expert!
Get step-by-step solutions from verified subject matter experts
Step: 2 Unlock
Step: 3 Unlock