

Question: 1) The graph below is a Normal (Gaussian) QQ plot based on a sample of n = 200 2) The graph below is a Normal

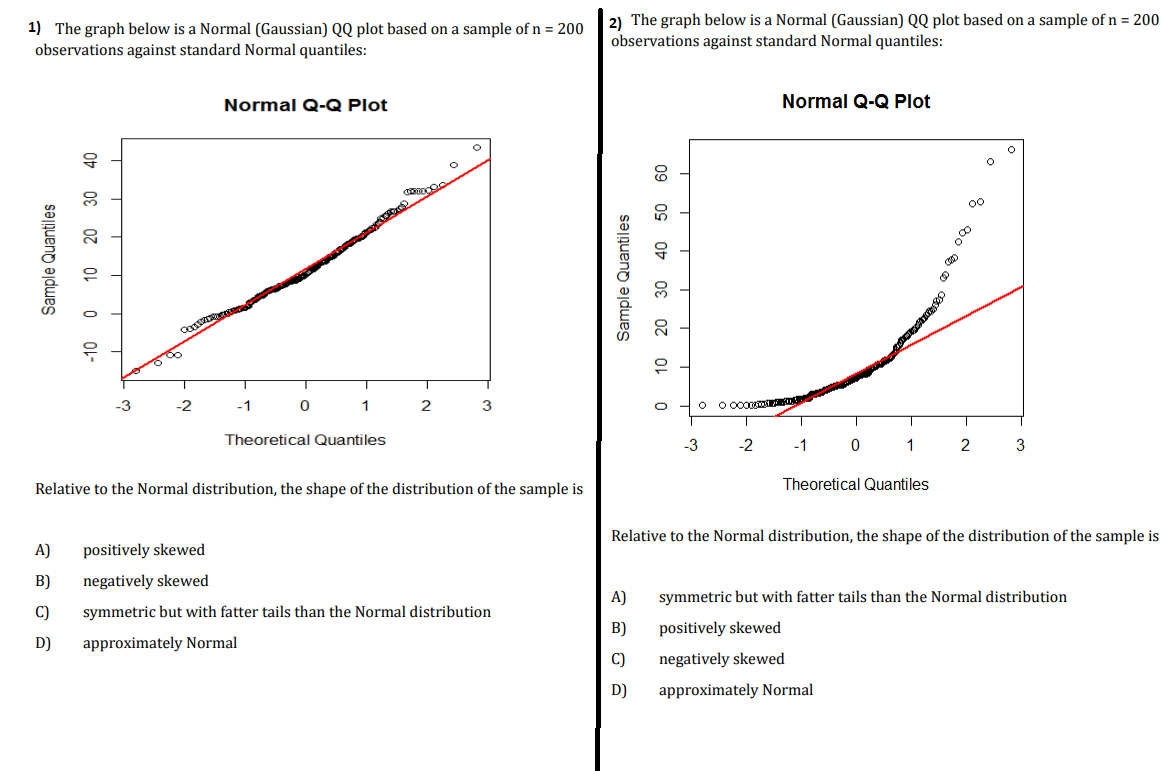
1) The graph below is a Normal (Gaussian) QQ plot based on a sample of n = 200 2) The graph below is a Normal (Gaussian) QQ plot based on a sample of n = 200 observations against standard Normal quantiles: observations against standard Normal quantiles: Normal Q-Q Plot Normal Q-Q Plot O O O OO Sample Quantiles -10 0 10 20 30 Sample Quantiles 10 20 30 40 50 -3 0 2 3 O Theoretical Quantiles -3 -2 - 1 2 3 Relative to the Normal distribution, the shape of the distribution of the sample is Theoretical Quantiles Relative to the Normal distribution, the shape of the distribution of the sample is A) positively skewed B) negatively skewed A) symmetric but with fatter tails than the Normal distribution symmetric but with fatter tails than the Normal distribution positively skewed DJ approximately Normal negatively skewed DJ approximately Normal
Step by Step Solution
There are 3 Steps involved in it

Get step-by-step solutions from verified subject matter experts