

Question: 1. The graph of a function f(a) is shown below. lim f(x) 2+ lim f(x) T-2 3 (2) 2 1/ In the table below,
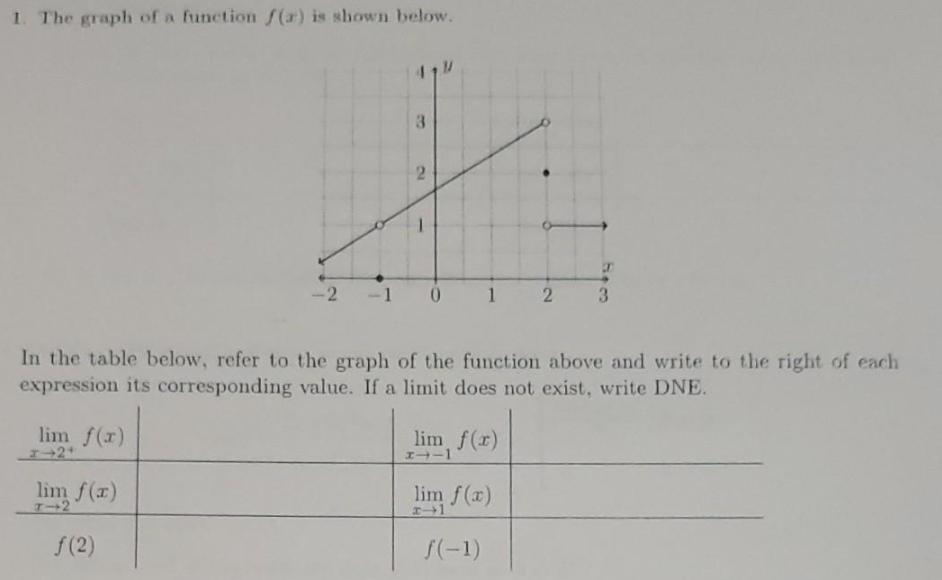
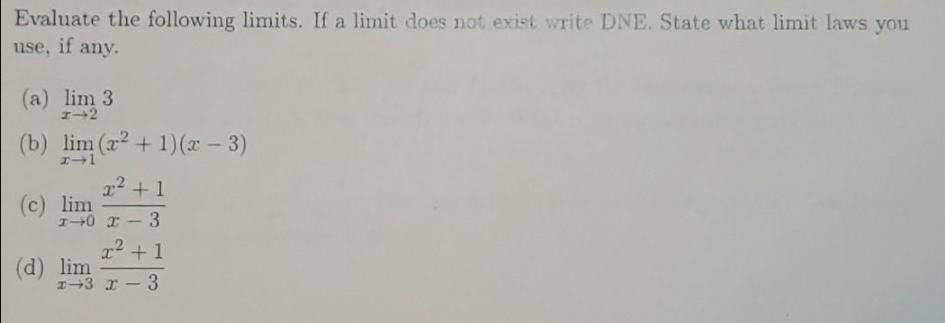
1. The graph of a function f(a) is shown below. lim f(x) 2+ lim f(x) T-2 3 (2) 2 1/ In the table below, refer to the graph of the function above and write to the right of each expression its corresponding value. If a limit does not exist, write DNE. -2 -1 0 1 2 3 lim, f(x) -1 lim f(x) 21 f(-1) Evaluate the following limits. If a limit does not exist write DNE. State what limit laws you use, if any. (a) lim 3 1-2 (b) lim (x + 1)(x-3) x-1 x + 1 I-0 X 3 x +1 1-3 x 3 (c) lim (d) lim - -
Step by Step Solution
3.46 Rating (156 Votes )
There are 3 Steps involved in it
Based on the provided image of the graph of a function fx and the table of limits and function values to be evaluated lets proceed with the analysis F... View full answer

Get step-by-step solutions from verified subject matter experts