

Question: 1. The graph shows two accounts with the same principal and annual interest rate. Use the graph to estimate the answer to each question. Show

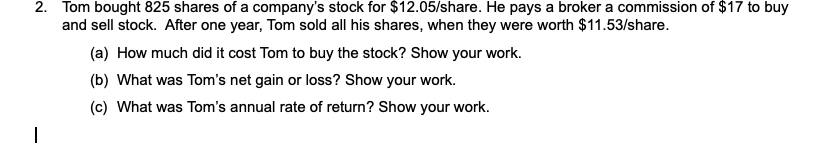
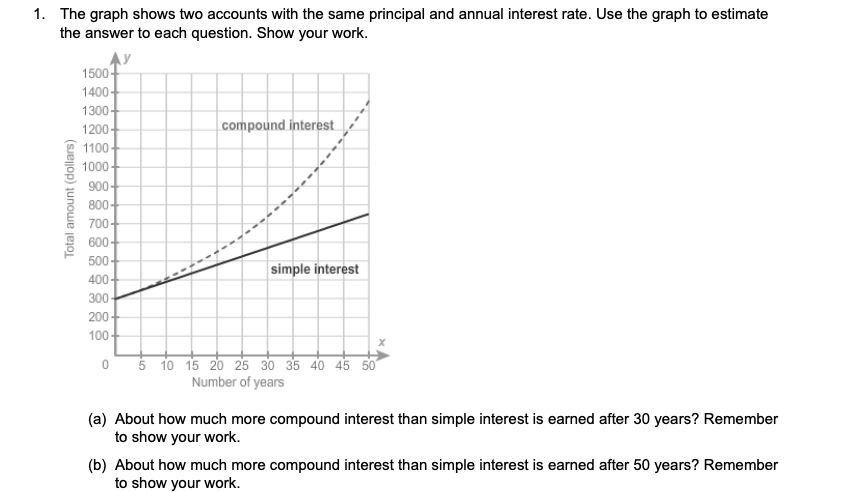

1. The graph shows two accounts with the same principal and annual interest rate. Use the graph to estimate the answer to each question. Show your work. Ay 1500- 1400- 1300 1200- compound interest 1100- 1000- 900 Total amount (dollars) 800 700- 600 500- simple interest 400 300 200- 100 X 0 5 10 15 20 25 30 35 40 45 50 Number of years (a) About how much more compound interest than simple interest is earned after 30 years? Remember to show your work. (b) About how much more compound interest than simple interest is earned after 50 years? Remember to show your work.2. Tom bought 825 shares of a company's stock for $12.05/share. He pays a broker a commission of $17 to buy and sell stock. After one year, Tom sold all his shares, when they were worth $11.53/share. (a) How much did it cost Tom to buy the stock? Show your work. (b) What was Tom's net gain or loss? Show your work. (c) What was Tom's annual rate of return? Show your work
Step by Step Solution
There are 3 Steps involved in it

Get step-by-step solutions from verified subject matter experts