

Question: 1. The histogram is appropriate for. A continuous variable. B. nominal variable. C. discrete variable. D. dichotomous variable. E. both nominal and discrete variable. 2.

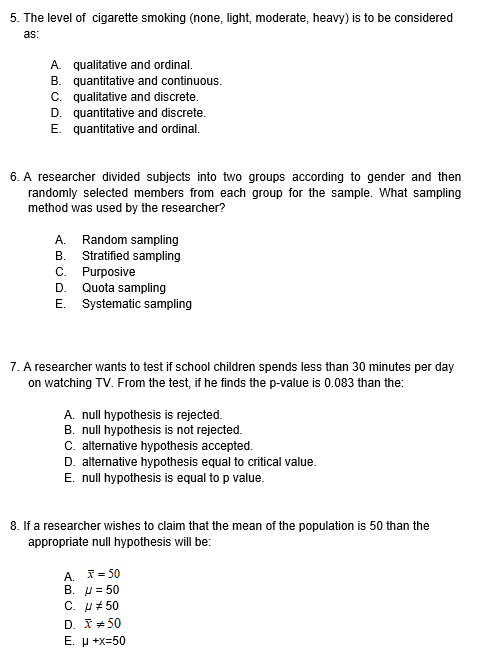
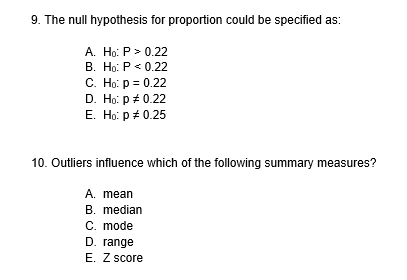


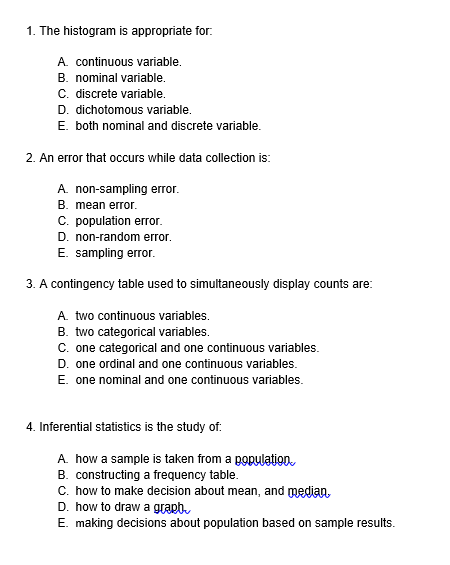


1. The histogram is appropriate for. A continuous variable. B. nominal variable. C. discrete variable. D. dichotomous variable. E. both nominal and discrete variable. 2. An error that occurs while data collection is: A non-sampling error. B. mean error. C. population error. D. non-random error. E. sampling error. 3. A contingency table used to simultaneously display counts are: A. two continuous variables. B. two categorical variables. C. one categorical and one continuous variables. D. one ordinal and one continuous variables. E. one nominal and one continuous variables. 4. Inferential statistics is the study of: A how a sample is taken from a population. B. constructing a frequency table. C. how to make decision about mean, and median, D. how to draw a graph E. making decisions about population based on sample results.5. The level of cigarette smoking (none, light, moderate, heavy) is to be considered as: A. qualitative and ordinal. B. quantitative and continuous. C. qualitative and discrete. D. quantitative and discrete. E. quantitative and ordinal. 6. A researcher divided subjects into two groups according to gender and then randomly selected members from each group for the sample. What sampling method was used by the researcher? A. Random sampling B. Stratified sampling C. Purposive D. Quota sampling E. Systematic sampling 7. A researcher wants to test if school children spends less than 30 minutes per day on watching TV. From the test, if he finds the p-value is 0.083 than the: A. null hypothesis is rejected. B. null hypothesis is not rejected. C. alternative hypothesis accepted. D. alternative hypothesis equal to critical value. E. null hypothesis is equal to p value. 8. If a researcher wishes to claim that the mean of the population is 50 than the appropriate null hypothesis will be: A. X =50 B. U = 50 C. U # 50 D. X #50 E. J +X=509. The null hypothesis for proportion could be specified as: A. Ho: P > 0.22 B. Ho: P
Step by Step Solution
There are 3 Steps involved in it

Get step-by-step solutions from verified subject matter experts