

Question: 1. The life expectancy and schooling data for 173 nations relating the response variable y= life ex- pectancy (in years) to the explanatory variable
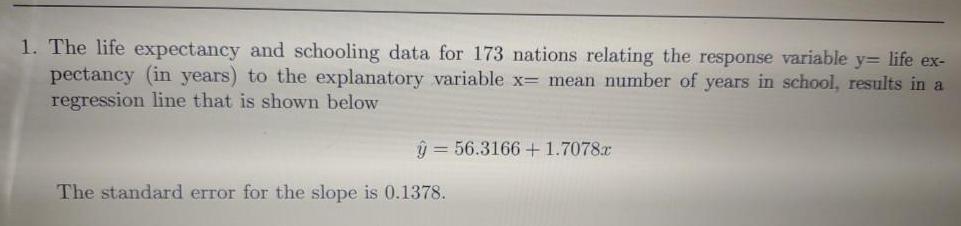
1. The life expectancy and schooling data for 173 nations relating the response variable y= life ex- pectancy (in years) to the explanatory variable x= mean number of years in school, results in a regression line that is shown below y=56.3166+1.7078x The standard error for the slope is 0.1378.
Step by Step Solution
There are 3 Steps involved in it
1 Expert Approved Answer
Step: 1 Unlock

Question Has Been Solved by an Expert!
Get step-by-step solutions from verified subject matter experts
Step: 2 Unlock
Step: 3 Unlock