

Question: 1. The midterm test scores for the typing class are listed below. Use the data to construct a stemplot in the following box. 91 106
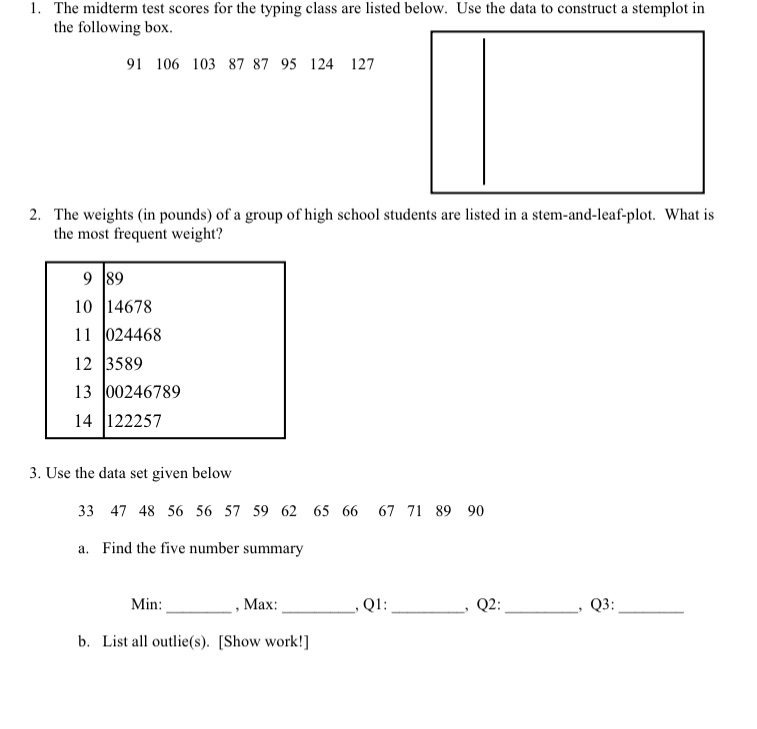
1. The midterm test scores for the typing class are listed below. Use the data to construct a stemplot in the following box. 91 106 103 87 87 95 124 127 2. The weights (in pounds) of a group of high school students are listed in a stem-and-leaf-plot. What is the most frequent weight? 9 189 10 14678 11 024468 2 3589 13 00246789 14 122257 3. Use the data set given below 33 47 48 56 56 57 59 62 65 66 67 71 89 90 a. Find the five number summary Min: Max: , Q1: Q2: Q3: b. List all outlie(s). [Show work!]
Step by Step Solution
There are 3 Steps involved in it
1 Expert Approved Answer
Step: 1 Unlock

Question Has Been Solved by an Expert!
Get step-by-step solutions from verified subject matter experts
Step: 2 Unlock
Step: 3 Unlock