

Question: 1 The scatter plot below shows the relationship between the number of members in a family and the amount of the family s weekly grocery
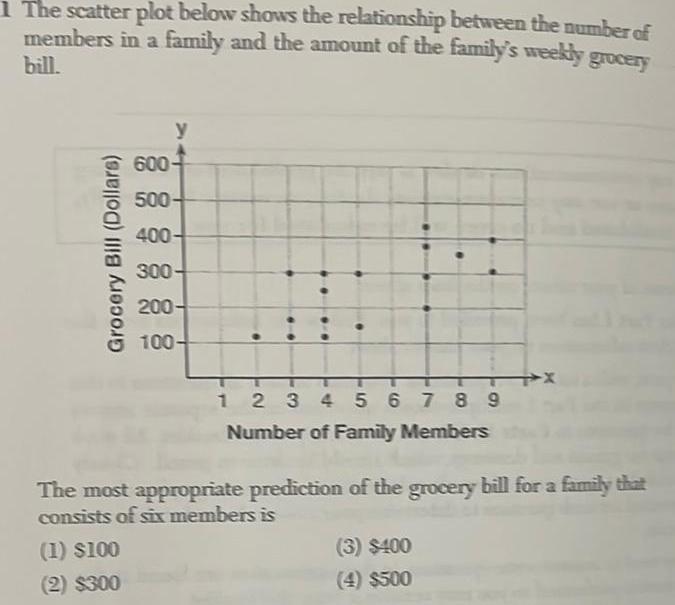

1 The scatter plot below shows the relationship between the number of members in a family and the amount of the family s weekly grocery bill Grocery Bill Dollars 600 500 400 300 200 100 1 100 2 300 1 2 3 4 5 6 7 8 9 Number of Family Members The most appropriate prediction of the grocery bill for a family that consists of six members is 3 400 4 500
Step by Step Solution
There are 3 Steps involved in it
1 Expert Approved Answer
Step: 1 Unlock

Question Has Been Solved by an Expert!
Get step-by-step solutions from verified subject matter experts
Step: 2 Unlock
Step: 3 Unlock