

Question: 1. The solid curve in the graph below gives position s of a car along a straight roadway (measured in meters), as a function of
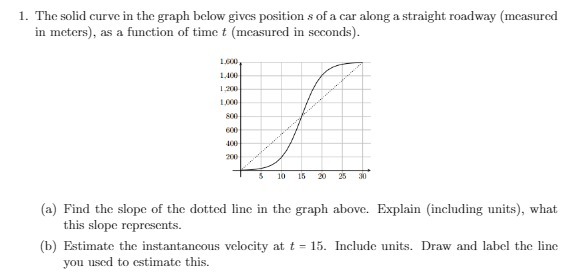
1. The solid curve in the graph below gives position s of a car along a straight roadway (measured in meters), as a function of time t (measured in seconds). 1.600 600 100 10 15 20 25 30 (a) Find the slope of the dotted line in the graph above. Explain (including units), what this slope represents. (b) Estimate the instantaneous velocity at t = 15. Include units. Draw and label the line you used to estimate this
Step by Step Solution
There are 3 Steps involved in it
1 Expert Approved Answer
Step: 1 Unlock

Question Has Been Solved by an Expert!
Get step-by-step solutions from verified subject matter experts
Step: 2 Unlock
Step: 3 Unlock