

Question: 1. The stem-and-leaf plot shown represents the number of points scored by the Blue Birds in their last 15 basketball games. Use the stem-and-leaf plot
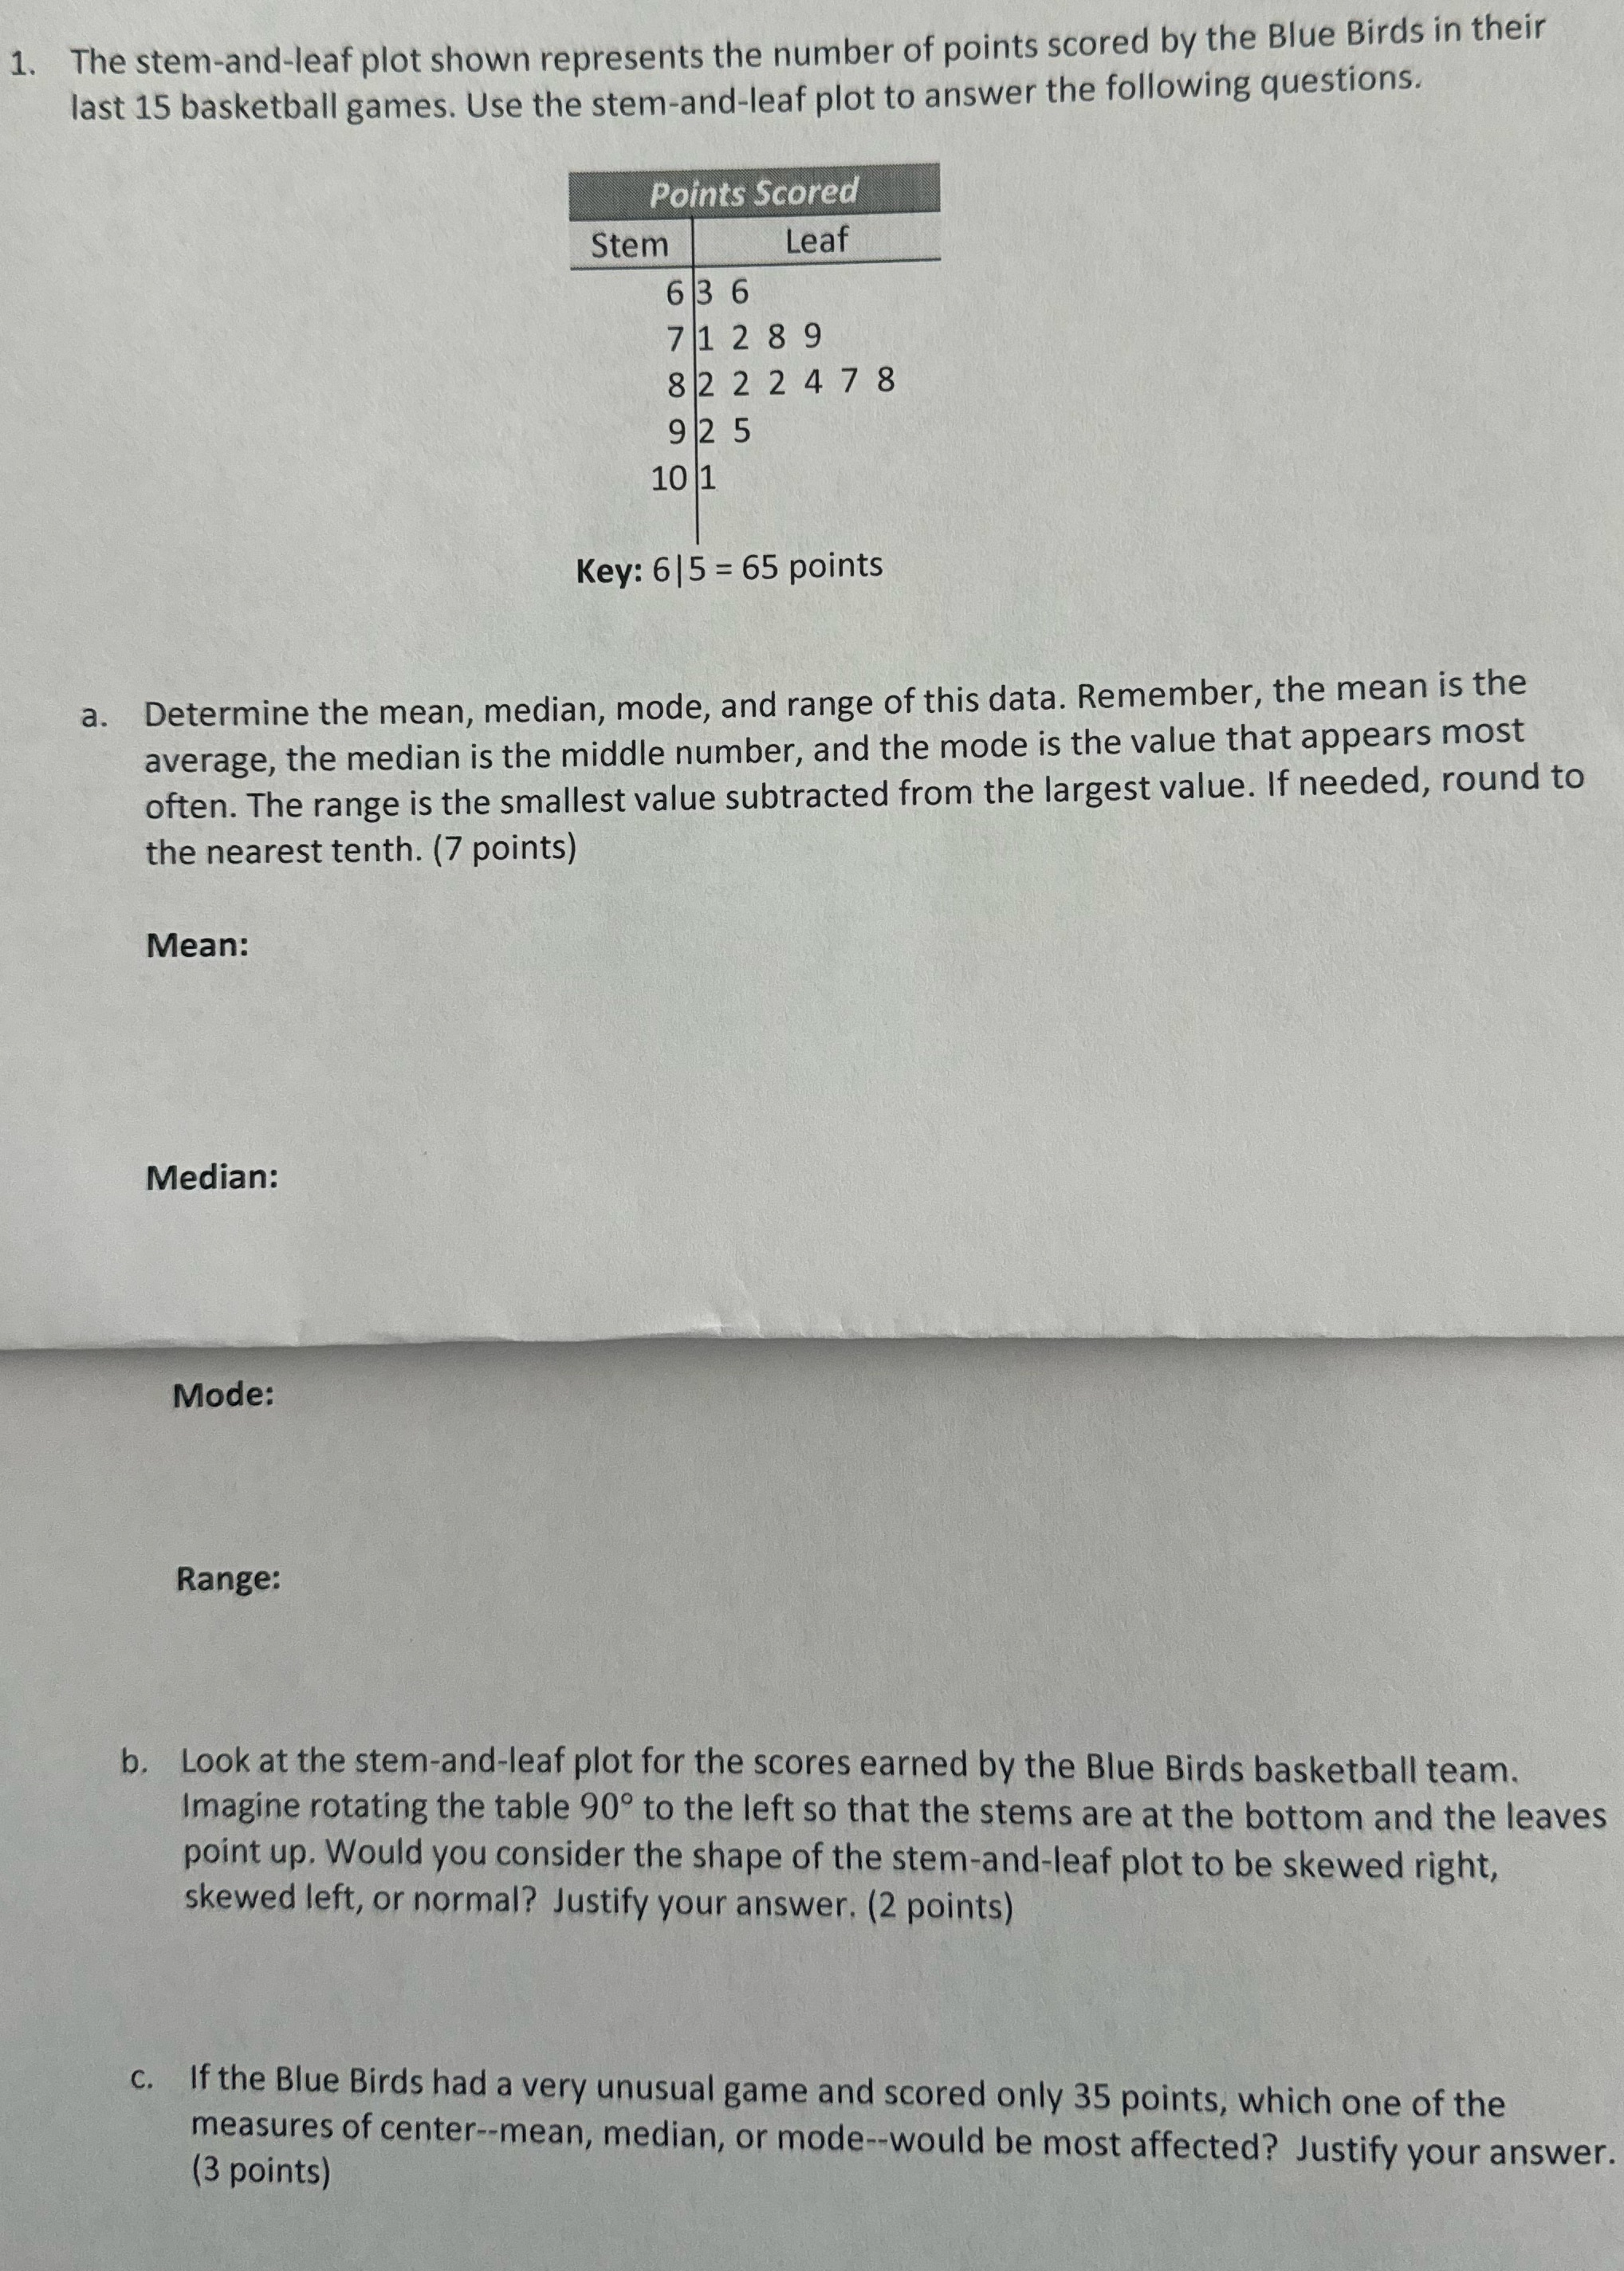
1. The stem-and-leaf plot shown represents the number of points scored by the Blue Birds in their last 15 basketball games. Use the stem-and-leaf plot to answer the following questions. Points Scored Stem Leaf 6 3 6 71289 8 2 2 2 4 7 8 9 2 5 10 1 Key: 6/5 = 65 points a. Determine the mean, median, mode, and range of this data. Remember, the mean is the average, the median is the middle number, and the mode is the value that appears most often. The range is the smallest value subtracted from the largest value. If needed, round to the nearest tenth. (7 points) Mean: Median: Mode: Range: b. Look at the stem-and-leaf plot for the scores earned by the Blue Birds basketball team. Imagine rotating the table 90 to the left so that the stems are at the bottom and the leaves point up. Would you consider the shape of the stem-and-leaf plot to be skewed right, skewed left, or normal? Justify your answer. (2 points) c. If the Blue Birds had a very unusual game and scored only 35 points, which one of the (3 points) measures of center--mean, median, or mode--would be most affected? Justify your
Step by Step Solution
There are 3 Steps involved in it

Get step-by-step solutions from verified subject matter experts